
Figure 3. Mapping Reveals Spiral Wave during AF in the Human Left Atrium.
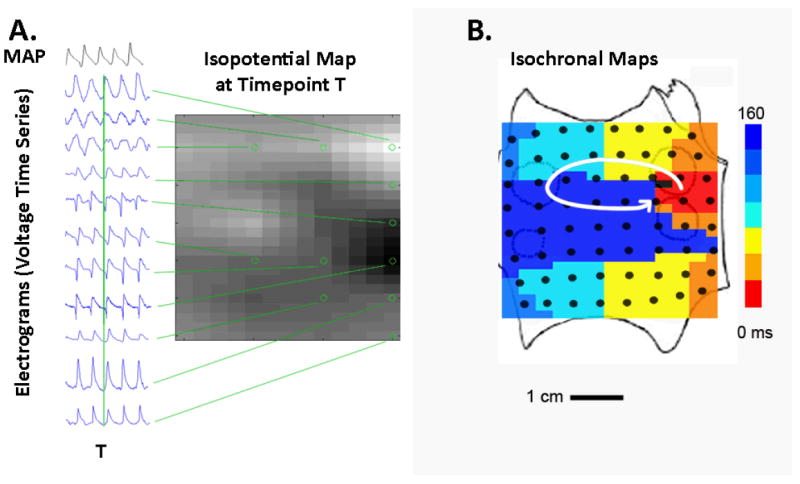
A. Raw electrograms used to create maps and movies. Unipolar electrograms (locations indicated by circles on grid) are used to construct an isopotential snapshot at any time point T (indicated by vertical green line). Monophasic action potentials (MAP) indicate repolarization and are used to calibrate unipolar electrograms. These isopotential maps are created successively for multiple time points T to create movies (see Supplemental movie). B. Isochronal snapshot of a LA rotor during one cycle of AF, created from activation times determined when each unipolar electrogram crosses a voltage threshold.