
Figure 1.
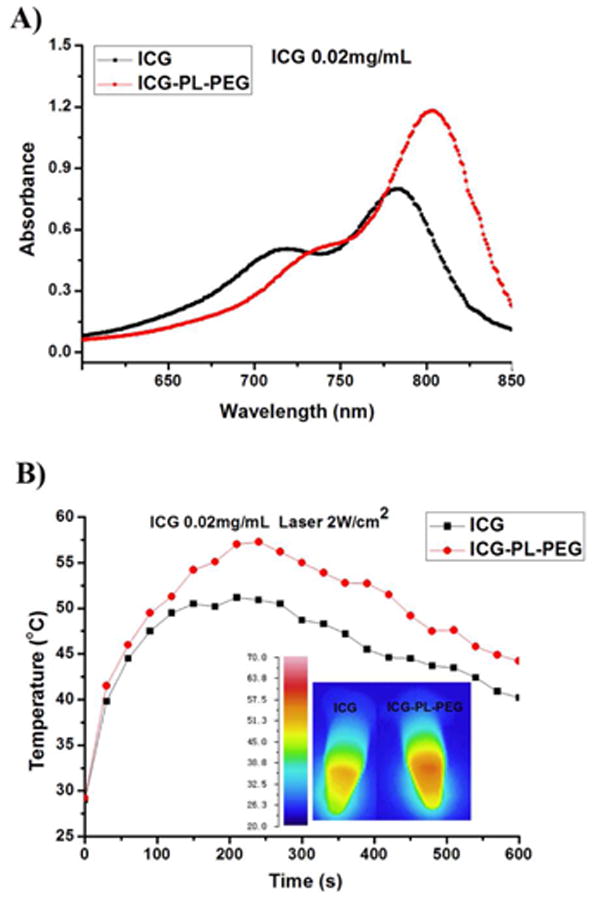
Absorption spectra and temperature increases of ICG and ICG-PL-PEG.
A. UV-vis-NIR absorption spectra of ICG and ICG-PL-PEG.
B. Temperature increases in ICG or ICG-PL-PEG formulation in response to irradiation of an 808-nm laser with a power density of 2 W/cm2 and a duration of 10 minutes. Inset: thermographic images of ICG and ICG-PL-PEG in vials after laser irradiation for 4 min.