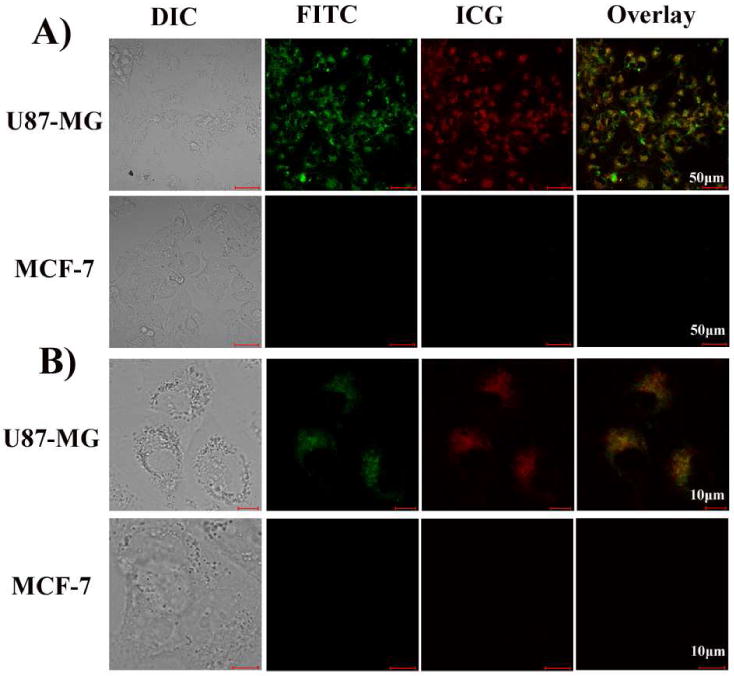
Figure 3.

A. Confocal images of U87-MG cells and MCF-7 cells after incubation in a solution of ICG-PL-PEG-mAb/FITC. U87-MG cells with overexpressed integrin αvβ3 show a high level of uptake of the targeting probe while MCF-7 cells with a low level of integrin αvβ3 show a low level of uptake. The fluorescence emissions from ICG (red) and FITC (green) were co-localized in U87-MG cancer cells, but absent in non-target cells (MCF-7), which was clear evidence that ICG-PL-PEG-mAb/FITC remained stable after entering target cells.
B. High-magnification images of fluorescence emission from cells.
