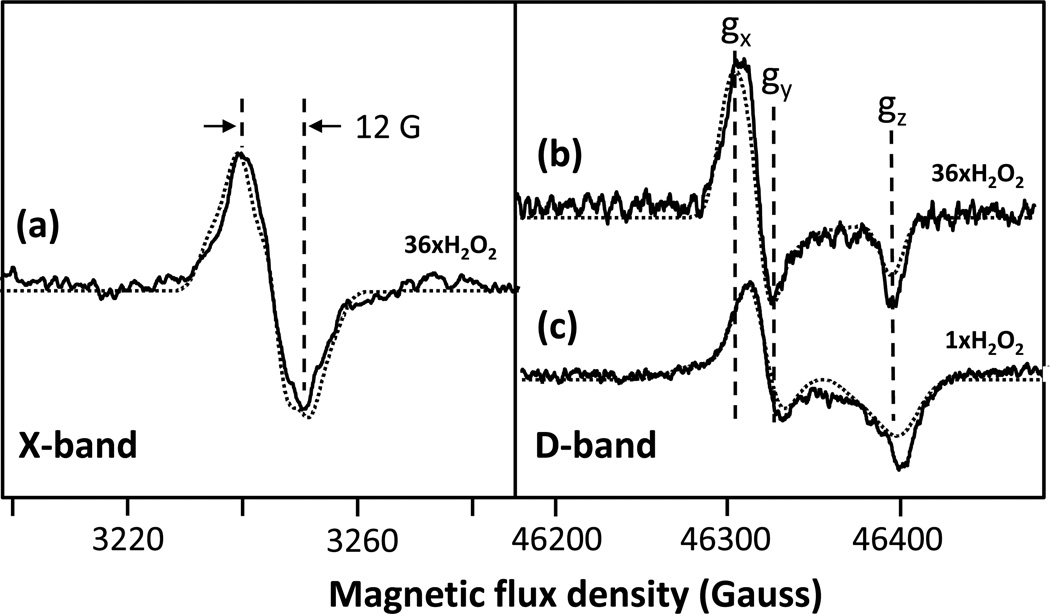
Figure 3. X-band and D-band EPR spectra of the intermediates formed in the reaction of bCcO with H2O2 at pH 8.
Panel (a) and (b) show the X-band and D-band spectra (solid lines), respectively, obtained following the reaction of bCcO with 36-fold excess of H2O2. Panel (c) shows the D-band spectrum (solid line) of bCcO obtained following its reaction with a stoichiometric amount of H2O2revealing contributions from both the 12 G and 46 G radicals. The experimental and simulation data are given by the solid and dotted lines, respectively. The parameters for the simulations are given in Table 1. In the X-band spectrum (a), the contribution from CuA has been removed by subtracting the spectrum of resting oxidized bCcO.

