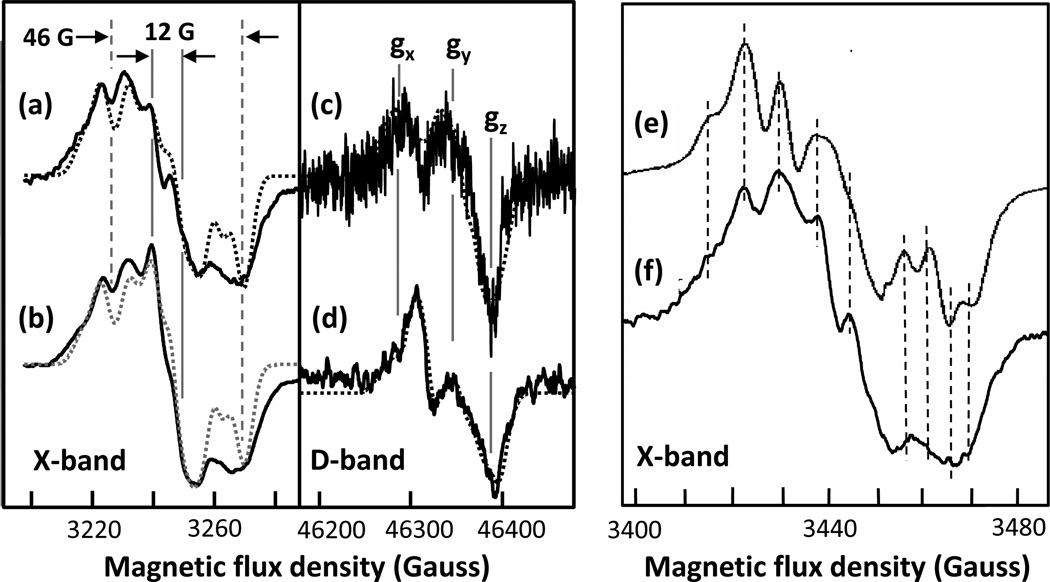
Figure 5. X-band and D-band EPR spectra of the intermediates formed in the reaction of CcO with H2O2 at pH 6.
The H2O2 (900 µM) used was ~2.5-fold excess of the enzyme (350 µM). Panels (b) and (d) are the observed spectra obtained at X-band and D-band, respectively while (a) and (c) are the corresponding spectra after subtraction of the 12 G radical. (f) is an expansion of the spectrum in (a) compared to that reported for PdCcO (e).17 The dashed lines in (e) and (f) are to help guide the eye. The dotted lines in (a–d) are simulated spectra with parameters given in Table 1. In the X-band spectra, the contributions from CuA have been removed by subtracting the spectrum of resting oxidized CcO.

