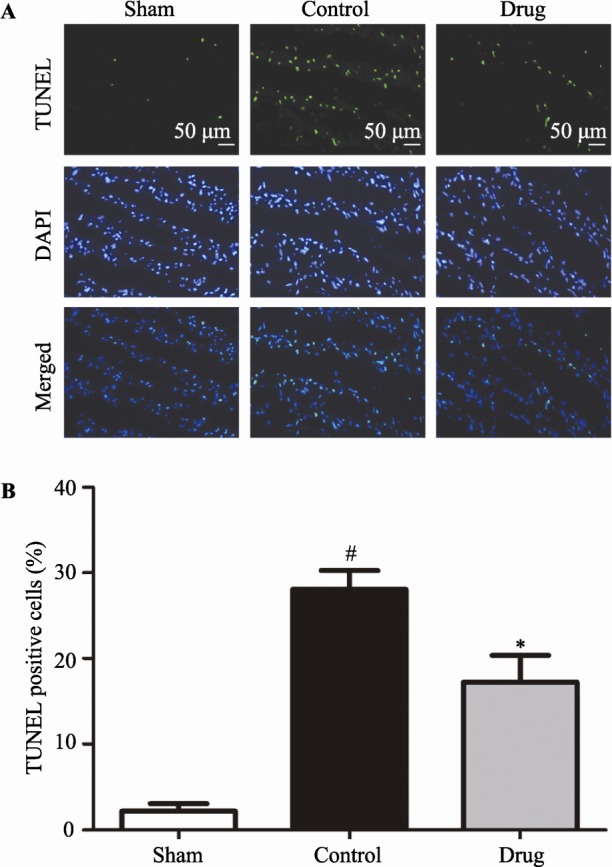
Figure 4. Myocardial apoptosis determined by TUNEL staining.

(A): Representative photomicrographs (× 200) of heart sections from rats subjected to sham myocardial ischemia, ischemia/reperfusion (30 minutes/2 hours) treated with vehicle, or ischemia/reperfusion (30 minutes/2 hours) treated with GXST are shown. TUNEL staining (green) indicates apoptotic nuclei; DAPI counterstaining (blue) indicates total nuclei. (B): Quantification of apoptotic nuclei (n = 5). Data are presented as mean ± SE. TUNEL-positive nuclei are expressed as a percentage of the total number of nuclei, automatically counted and calculated using Image-Pro Plus software. #P < 0.05 vs. Sham, *P < 0.05 vs. Control.
