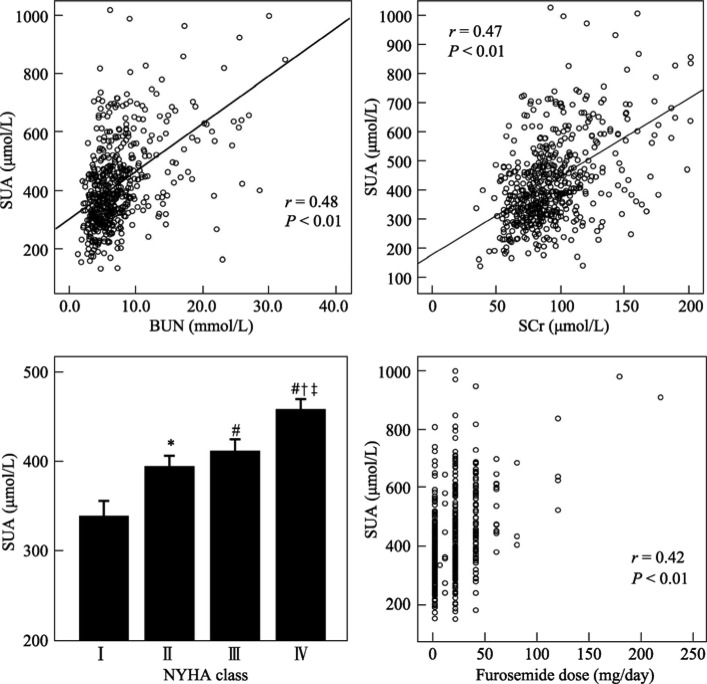
Figure 1. Plots of SUA concentrations against BUN, SCr, NYHA class and furosemide dose.
For NYHA functional class, SUA values are plotted as mean ± SD. *P < 0.05 compared with NYHA functional class I. # P < 0.01 compared with NYHA functional class I. † P < 0.01 compared with NYHA functional class II. ‡ P < 0.01 compared with NYHA functional class III. BUN: blood urea nitrogen; NYHA: New York Heart Association; SCr: serum creatinine; SUA: serum uric acid.

