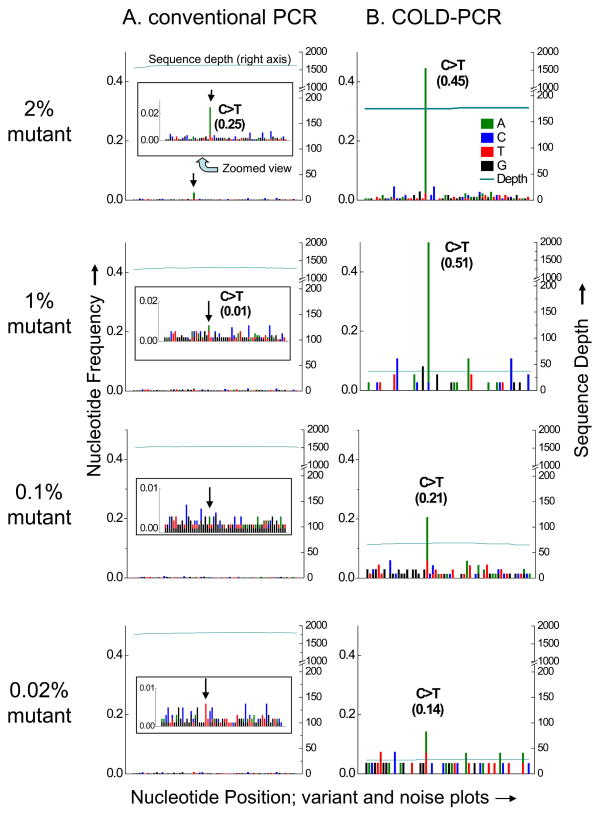
Figure 1.
Variant and noise frequency plots for TP53 exon 10 serial dilutions of mutant into wild type DNA, amplified with conventional PCR (A) or COLD-PCR (B) and followed by Illumina NGS. NGS sequence plots and alignments are presented for the anti-sense strand. The terminating mutation in human cell-line UACC-893 (c.1024C>T, p.Arg342X) is evident in the NGS sequencing calls of the conventional PCR amplicons (A) for the 2% mutational abundance, though cannot be called confidently for the 1% mutational abundance or less, due to the background noise. The inset panel provides a zoomed-in view. Conversely, it is evident that much lower abundances of mutations can be detected due to the enrichment by COLD-PCR (B). In COLD-PCR, even the 0.02% pre-amplification mutational abundance is visible above the noise as it is enriched to ~14%. Sequence depth (right axis) presents the number of sequence reads aligning to the amplicon region.

