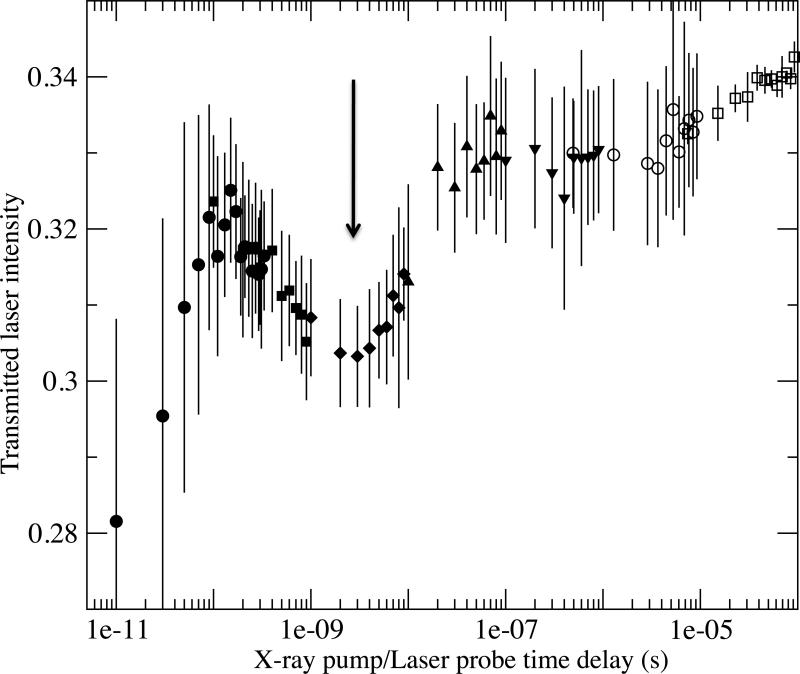
Figure 4. Transmission at 890 nm from 1 × 10–11 to 1 × 10⁻⁴ s.
Induced opacity is seen as the dip below 1 × 10⁻¹⁰ s. The arrow denotes the second opacity region at ~1 × 10⁻⁹ s. The gradual increase at longer times reflects the increase in bandgap as the specimen cools. Different symbols refer to separate scans of overlapping time domains. Error bars are standard deviation of measurements from 100 X-ray pulses, except the last set (square symbols) of smaller error bars, which are calculated from multiple repeated scans.

