
Figure 3.
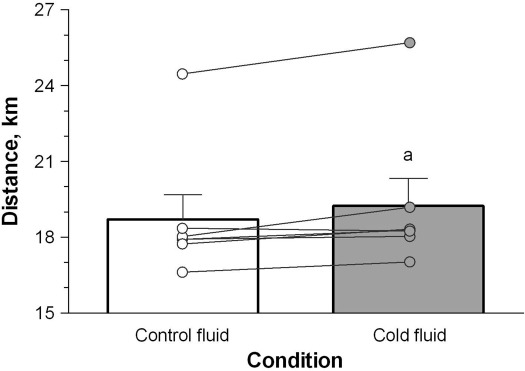
Distance cycled in 30 minutes after ingestion of 37°C (control) or 2°C (cold) fluid. a Indicates a greater distance cycled during the cold fluid than the control-fluid trial (P = .03). Values are mean ± SEM. Lines represent individual responses to the 2 treatments.