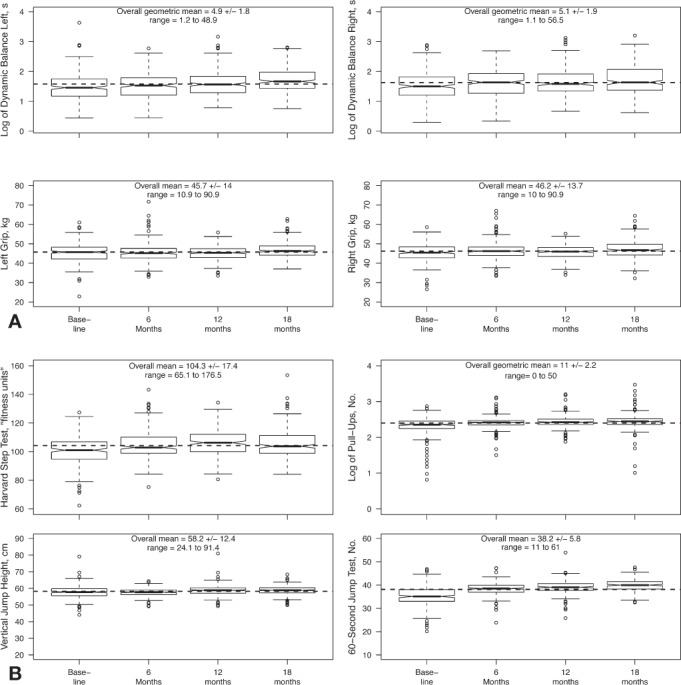
Figure 1.

Box plots for fitness tests across all time points. A, Tests applied to both right and left limbs. B, Other tests. Log-transformed data are provided for the balance test and pull-up test because the distributions were highly skewed. For any time point, the box indicates the 25th and 75th percentiles, and the dark bar represents the median. Notches around the median that do not overlap provide strong evidence for a difference in medians. The whiskers represent 1 interquartile region below and above the 25th and 75th percentiles, respectively, and the circles represent the outlying data points. The overall mean ± SD across all 4 time periods is indicated by the dotted line. We also provide the numeric value for the mean, SD, and range across all time points (or geometric mean [geometric SD] for log-transformed data) for each test.
