
Figure 2.
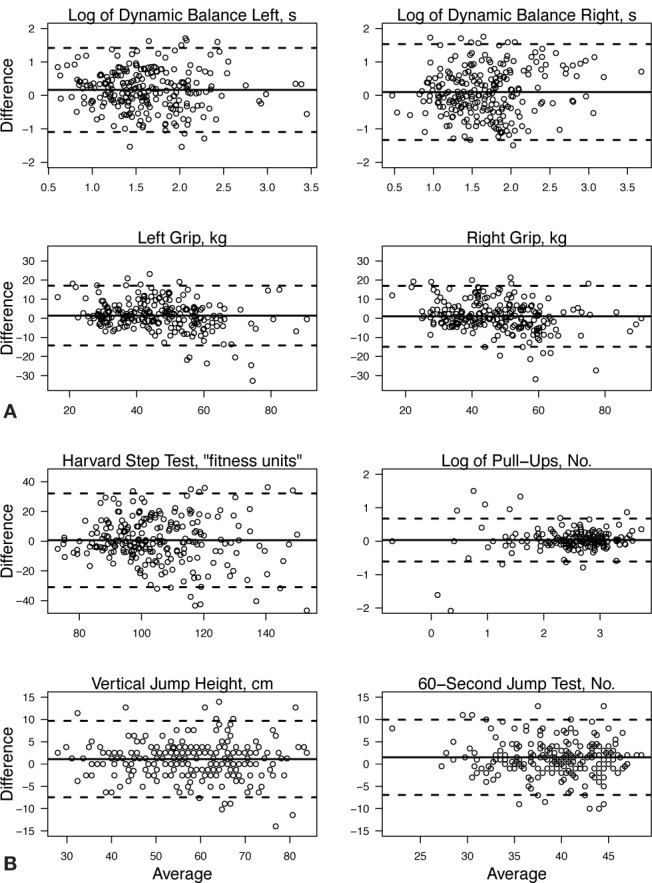
Scatterplots represent the limits of agreement (difference between 2 tests plotted against the average of the 2 tests) for each of the physical capacity assessments conducted. The analysis is limited to the comparison of 18-month and 6-month data because our preliminary data indicated that baseline testing was not reliable due to administrator issues (see text). The solid lines represent the overall means for all performers at all 4 time points. The dotted lines above and below the center solid line represent the upper and lower limits of agreement.