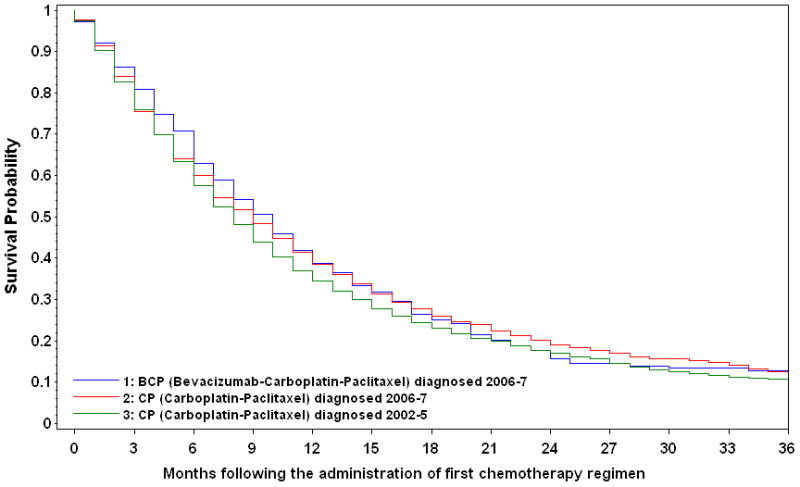
Figure 2.

Kaplan-Meier Survival Curves for Medicare Beneficiaries Diagnosed with Advanced Non-Squamous Non-Small-Cell Lung Cancer, by Year of Diagnosis and First-Line Chemotherapy Administration with or without Bevacizumab
| No. at risk Groups | Months following the administration of first chemotherapy regimen | ||||||
|---|---|---|---|---|---|---|---|
| 0 | 6 | 12 | 18 | 24 | 30 | 36 | |
| 1 | 318 | 225 | 133 | 84 | 54 | 31 | 17 |
| 2 | 1182 | 756 | 489 | 328 | 228 | 133 | 68 |
| 3 | 2664 | 1688 | 982 | 652 | 472 | 348 | 283 |
