
Figure 3.
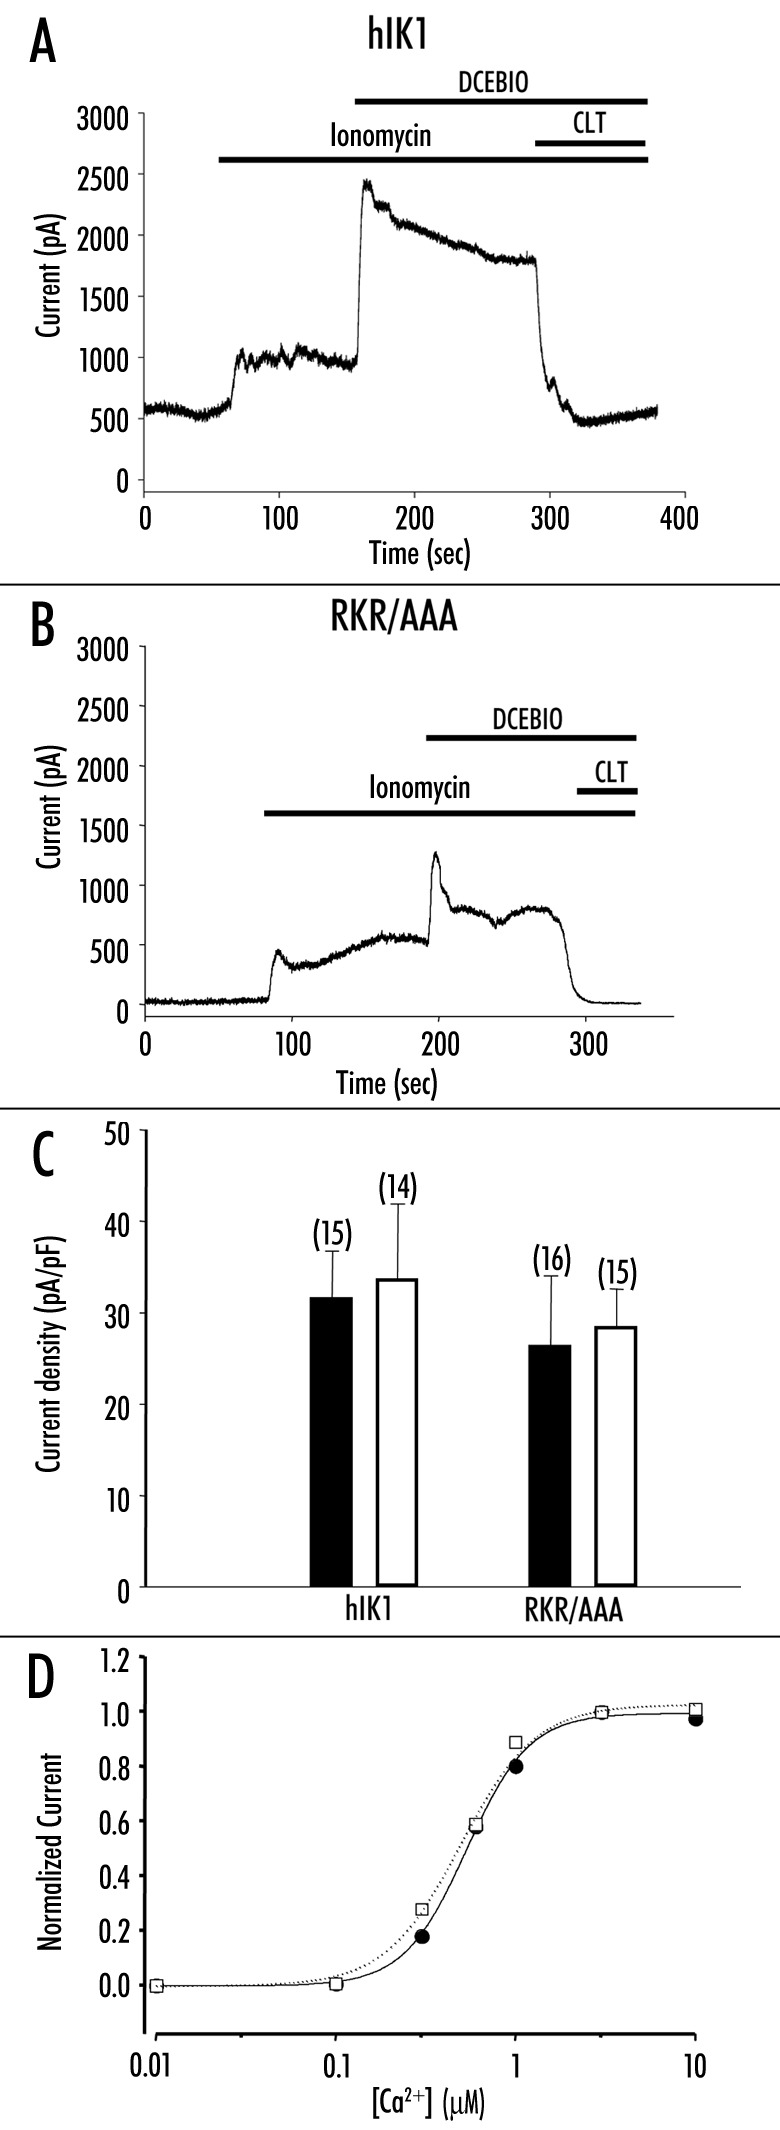
Increased Ca2+ activates RKR/AAA‑expressing channels. Representative whole-cell current traces from (A) HA‑hIK1 or (B) RKR/AAA -stably transfected HEK293 in response to 2 mM ionomycin, 10 mM DCEBIO and 3 mM clotrimazole. (C) Summary bar graph showing that ionomycin (2 mM) increases current density in both wild‑type (HA‑hIK1) and RKR/AAA‑expressing cells (solid bars). Subsequent to ionomycin, DCEBIO (10 mM) induces an equivalent increase in current density in wild‑type and RKR/AAA‑expressing cells (open bars). The numbers of experiments are indicated in parenthesis. The values are not statistically different between HA‑hIK1 and RKR/AAA‑expressing cells. (D) Average Ca2+ -concentration‑response curves for wild‑type hIK1 (filled circles, solid line, n = 12) and RKR/AAA‑expressing (open squares, dashed line, n = 11) cells. Error bars have been omitted for clarity. The lines show the best fit to the data using Hill equation (I = [Ca2+]n/(K0.5n + [Ca2+]n)). The apparent -affinity (K0.5) and Hill coefficient were not different for wild‑type and RKR/AAA hIK1 (WT, K0.5 = 512 ± 7nM, Hill -coefficient = 2.7; RKR/AAA, K0.5 = 527 ± 29 nM, Hill coefficient = 2.7).