
Figure 9.
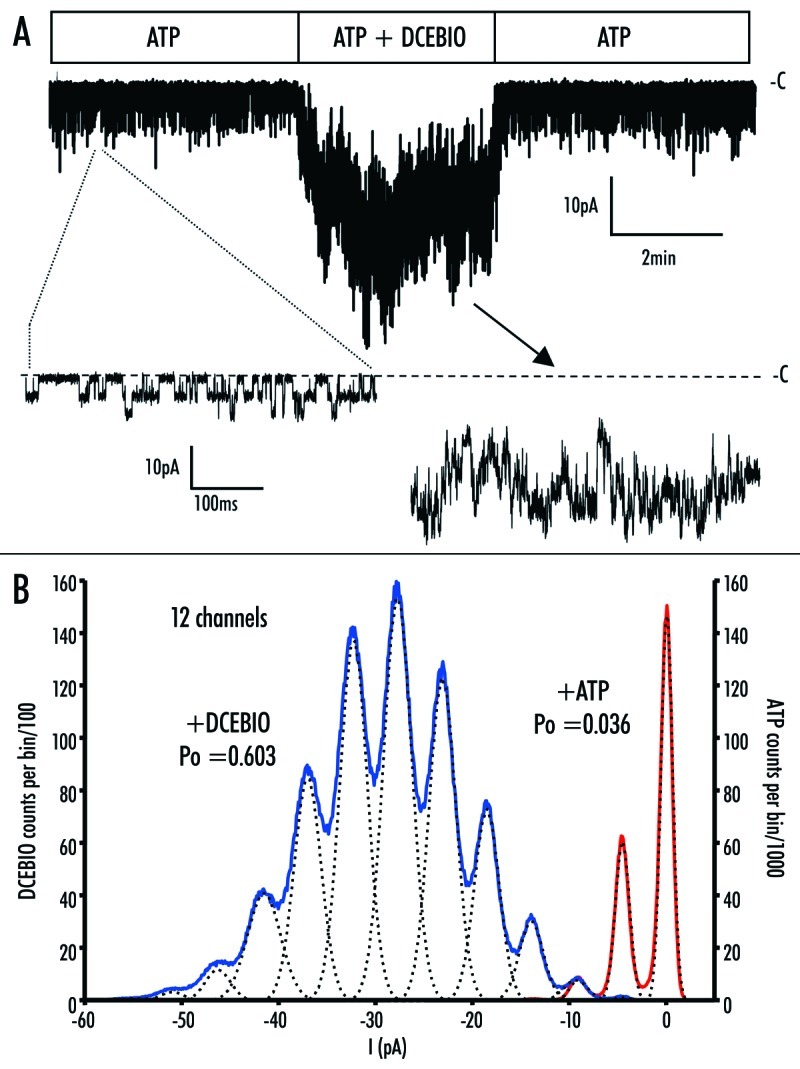
(A) Excised patch of RKR/AAA hIK1 showing activation by DCEBIO (10 mM). Expanded current traces in the presence of ATP (300 mM) and DCEBIO are shown where the dashed line indicates the closed state (‑C) of the channel. Changes in seal resistance were compensated for and removed by processing current trace with Biopatch software. Current spike artifacts during solution change have been removed. (B) Amplitude histogram of the recording shown in (A). A bin size of 0.1 pA was used and the data were fit as described in the Methods. The red trace shows the gaussian fit to the current in the presence of ATP, whereas the blue trace shows the gaussian fit to the current trace in the presence of DCEBIO. The dashed lines are the fits to the individual peaks in the amplitude histogram. Based on these fits we calculated open probabilities (Po) of 0.036 and 0.603 for RKR/AAA hIK1 in the presence of ATP and DCEBIO, respectively.