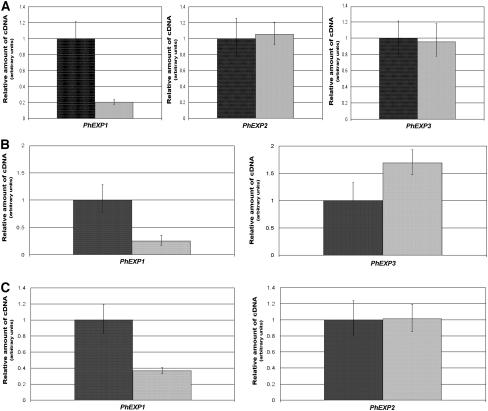
Figure 4.
Specific Transcript Level Reduction of PhEXP1.
Total RNA was extracted from petals, ovaries, and sepals. Each sample represents pools of material collected at 140, 180, and 250 h AFBA. Semiquantitative real-time RT-PCR analyses were performed with specific primers homologous to the 3′ untranslated region of PhEXP1, PhEXP2, and PhEXP3.
(A) Semiquantitative real-time RT-PCR analysis of PhEXP1, PhEXP2, and PhEXP3 transcript levels in wild-type (dark gray) and line 25 (light gray) petals.
(B) Semiquantitative real-time RT-PCR analysis of PhEXP1 and PhEXP3 transcript levels in wild-type (dark gray) and line 25 (light gray) ovaries.
(C) Semiquantitative real-time RT-PCR analysis of PhEXP1 and PhEXP2 transcript levels in wild-type (dark gray) and line 25 (light gray) sepals.
Error bars represent standard deviation.

