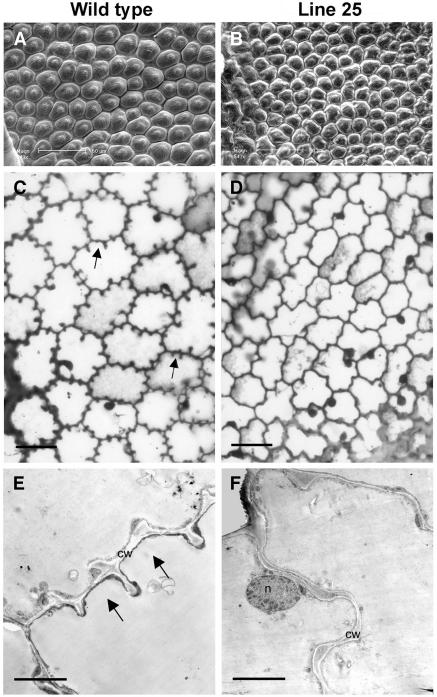
Figure 7.
Changes in Cell Shape in Line 25.
(A) and (B) Scanning electron micrographs of abaxial epidermal limb cells at anthesis. Bars = 50 μm.
(C) and (D) Tangential semithin sections of abaxial epidermis of petal limb at anthesis. Arrows indicate the characteristic cell wall lobes. Bars = 25 μm.
(E) and (F) Transmission electron micrographs of tangential ultrathin sections of the abaxial epidermis of petal limb at anthesis. cw, cell wall; n, nucleus. Bars = 5 μm.

