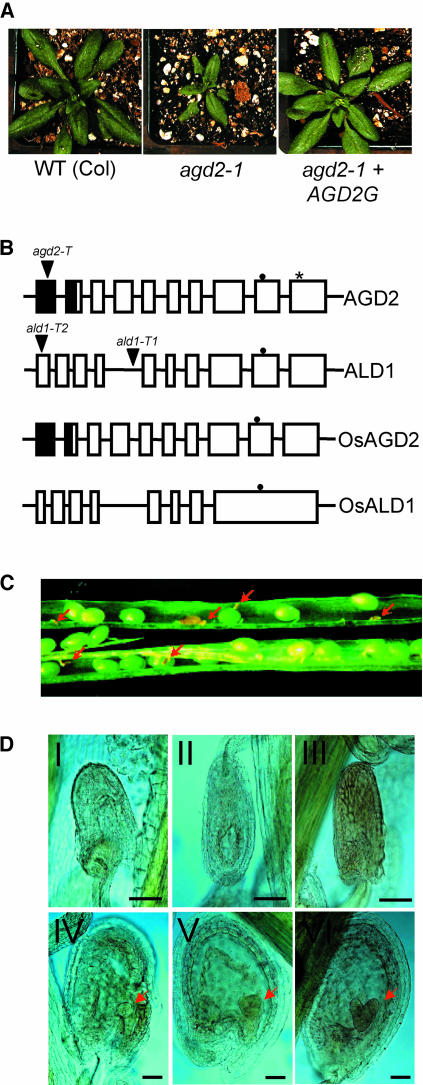
Figure 1.
Features of AGD2, ALD1, and agd2-T.
(A) Complementation of agd2-1. agd2-1 plants were transformed with the genomic clone of AGD2 (AGD2G, at right). The plants shown at the left and in the middle are untransformed wild-type and agd2-1 control plants. agd2-1 plants transformed with the genes adjacent to AGD2 were not complemented (data not shown).
(B) Molecular structures of AGD2, ALD1, OsAGD2, and OsALD1. T-DNA insertion sites are indicated by triangles. The asterisk indicates the Pro-to-Ser change caused by the agd2-1 allele. Closed and open boxes represent exons, and closed boxes represent possible chloroplast transit peptides. The closed circles indicate the pyridoxal-5′-phosphate attachment sites.
(C) Immature seeds inside a heterozygous agd2-T/AGD2 silique. Aborted dead seeds are indicated by red arrows.
(D) Microscopy analysis of aborted and normal seeds in agd2-T/AGD2 heterozygotes. Embryos are indicated by red arrows. Top panel (I to III), dying and dead seeds; bottom panel (IV to VI), normal seeds. IV, Globular stage; V, triangular stage; VI, heart stage. Bars = 80 μm.

