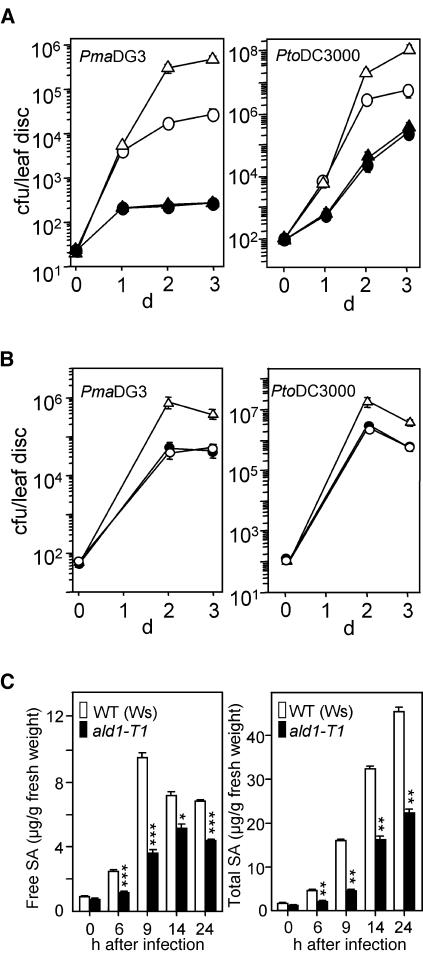
Figure 4.
Increased Disease Susceptibility in the ald1-T1 Mutant.
(A) Disease susceptibility of ald1-T1 plants. Wild-type Ws (open circles) and ald1-T1 (open triangles) plants were infected with P. s. maculicola DG3 (PmaDG3, at left) or with P. s. tomato DC3000 (PtoDC3000, at right) at OD600 = 0.0001. Growth of P. syringae in Ws and ald1-T1 was significantly different on days 2 and 3 (P < 0.01, t test, n = 8). Ws and ald1-T1 plants were pretreated with 100 μM BTH or water for 2 d and then subjected to infection with P. s. maculicola DG3. BTH-treated Ws (closed circles) and ald1-T1 (closed triangles) were not significantly different for bacterial growth (P > 0.5, t test, n = 8). cfu, colony-forming units. Bars indicate standard error. In some cases, the symbols obscure the error bars.
(B) Complementation of the ald1-T1 mutant phenotype. Ws (open circles), ald1-T1 (open triangles), and ald1-T1 transformed with the ALD1 genomic clone (closed circles) were infected with P. s. maculicola DG3 (PmaDG3, at left) or P. s. tomato DC3000 (PtoDC3000, at right) at OD600 = 0.0001. Growth of P. syringae in Ws and ald1-T1 was significantly different on days 2 and 3 (P < 0.01, t test, n = 8), whereas growth in Ws and the transgenic plants was not different (P > 0.7, t test, n = 8).
(C) SA levels in Ws and ald1-T1 plants during pathogen infection. Leaves (fourth and fifth) from 18-d-old plants were infected with P. s. maculicola DG3 (OD600 = 0.01) and were harvested, extracted, and analyzed by HPLC. The free and total SA values ±sd are averages of three sets of samples. The number of asterisks indicates samples that are significantly different from one another at a given confidence level (one asterisk, P < 0.004; two asterisks, P < 0.0008; three asterisks, P < 0.0002).

