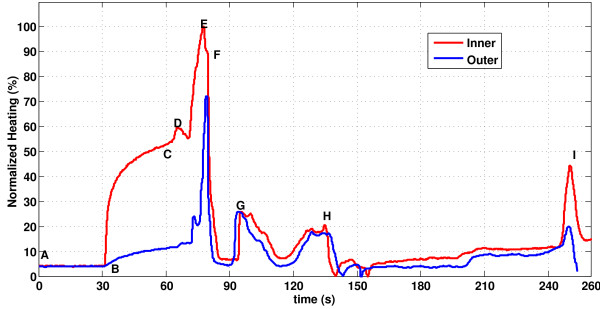
Figure 4.
Temperature distribution on guidewire during MR scan.A heating profile is obtained by moving temperature sensors within (red) and on the surface of (blue)the guidewire. The probes begin beyond the guidewire distal tip. Segment A-B indicates a 30 second baseline recording; MRI begins at B; a relative steady-state is achieved at C, when probe pullback begins. Temperature peaks correspond to physical landmarks including: D, the distal end of the solenoid coil; E, the guidewire “hotspot;” F, the proximal end of the solenoid coil; G, the inner rod-hypotube junction point; H, gel phantom entry point; H-I, air; I, hypotube-MMCX connector solder point.

