Figure 8.
ABI8 Expression.
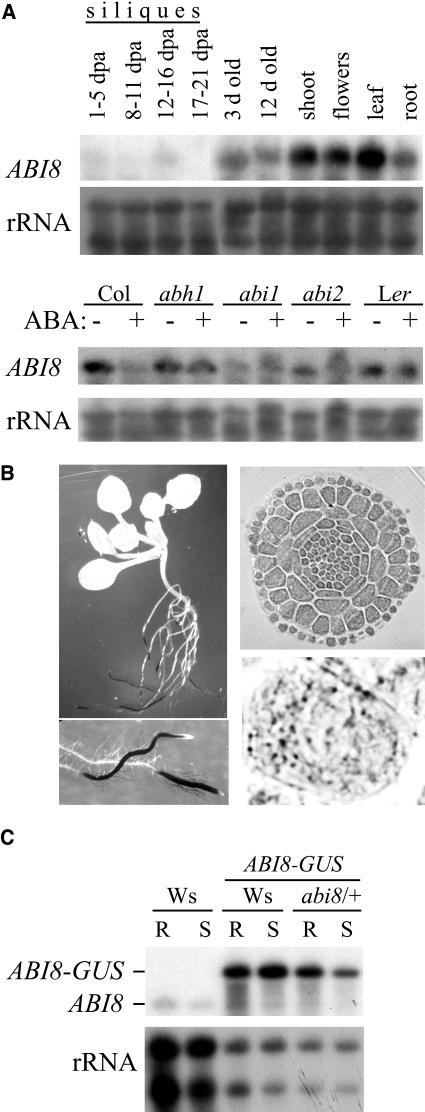
(A) RNA gel blot analyses of ABI8 transcript accumulation in assorted tissues and genotypes. ABA response in different genotypes was compared in 2-week-old plants exposed to 50 μM or no ABA for the last 2 d of culture. Col, Columbia ecotype; Ler, Landsberg erecta ecotype.
(B) Localization of GUS activity derived from an ABI8-GUS fusion, including the entire ABI8 coding sequence, under control of the ABI8 promoter. Left, entire plant and root tip; right, cross-section through root tip of 2-week-old plant and high-magnification view of a single cell showing the punctate staining pattern.
(C) RNA gel blot analyses of ABI8 and ABI8-GUS transcript accumulation in transgenic lines. R, roots; S, shoots.

