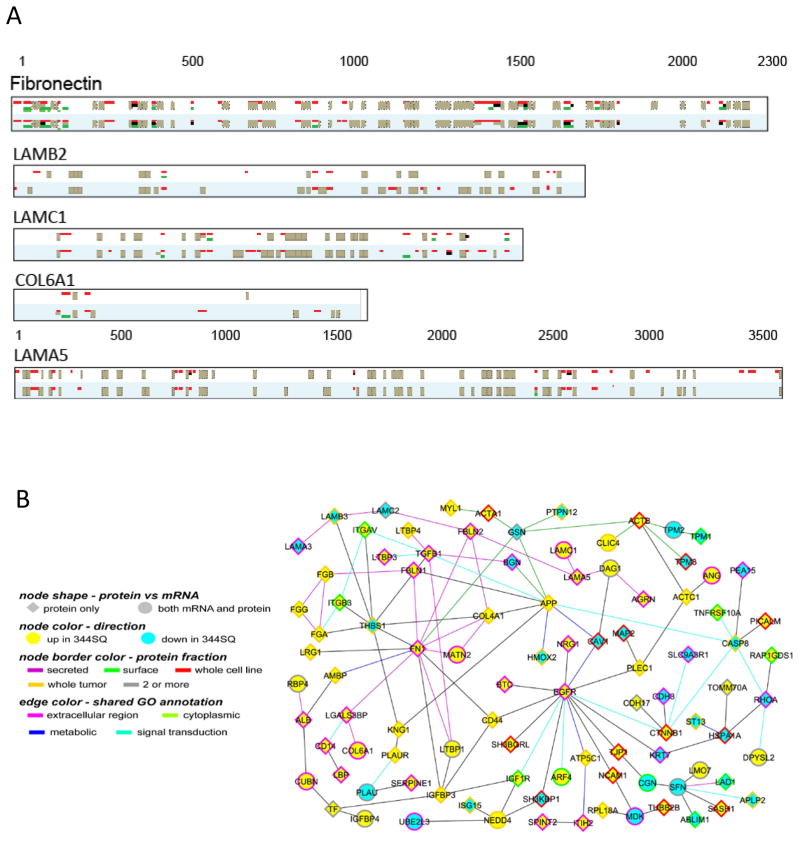
Figure 2.
A. Peptide coverage of extracellular matrix proteins. Peptides upregulated in 344sq are red, downregulated peptides green, unchanged peptides black, and non-quantified peptides gray. For each protein, the top panel is labeling mix 1 and the bottom is mix 2. B. Protein-protein interaction network of differentially expressed proteins and genes (mRNAs) in 344SQ cells. Graph is comprised of proteins differentially expressed in any one of the four fractions (fold change>1.5, both duplicates). Nodes, proteins; circle nodes, proteins also differentially expressed at mRNA transcript level (P<0.01, t-test); yellow/blue, overexpression/underexpression in 344SQ, respectively. A line between two nodes signifies that the corresponding proteins can physically interact (according to the literature). Node border color, protein fraction showing differential patterns. Colored edges (other than gray), a common gene ontology term annotation shared by both of the connected proteins.

