
Figure 3.
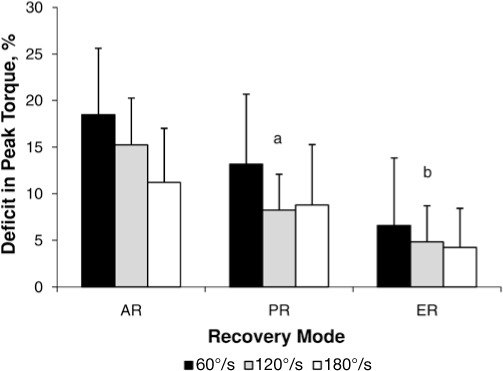
Deficit in isokinetic peak torque measured after the fatiguing exercise at 60°/s, 120°/s, and 180°/s. Values are mean ± SD.
a The deficit in peak torque was less after PR than after AR (P < .001).
b In addition, the deficit in peak torque observed after the ER was lower than after the AR and PR interventions (P < .001). Abbreviations: AR, active recovery; ER, electromyostimulation; PR, passive recovery.