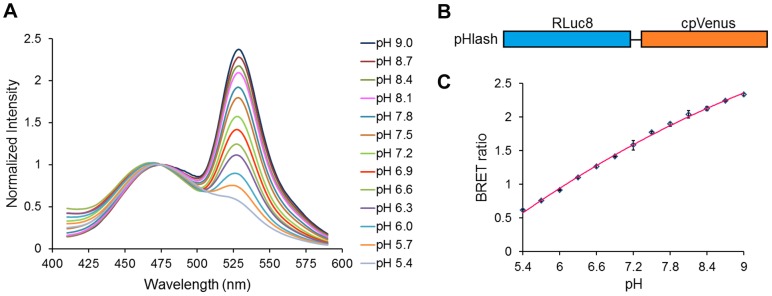
Figure 1. pH response of purified pHlash protein in vitro.
(A) Normalized luminescence emission spectra of pHlash with 10 µM native coelenterazine at pH 5.4–9.0 (legend shown at right) of purified pHlash protein in 50 mM BIS-Tris-propane, 100 mM KCl, and 100 mM NaCl. Luminescence intensity was normalized to the peak at 475 nm (non-normalized data shown in Figure 2). (B) Construct of the pHlash fusion protein. Rluc8 was linked to cpVenus by the sequence Ala-Glu-Leu. (C) The BRET ratio (luminescence at 525 nm:475 nm) as a function of pH is shown for pHlash in vitro. Error bars are +/− S.D., but in most cases the error bars are so small that they are obscured by the symbols (n = 3).

