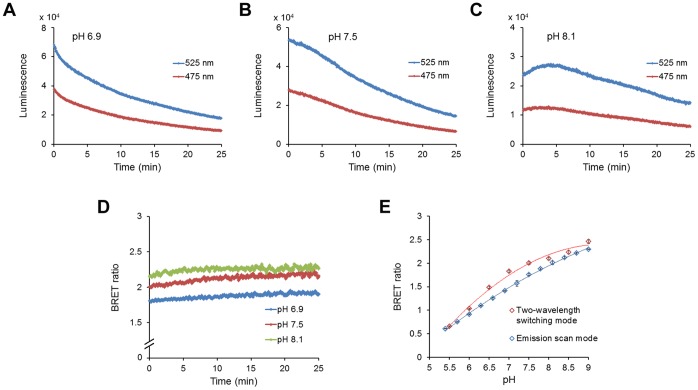
Figure 3. Time course recordings of purified pHlash protein at three different pHs in vitro.
(A) pH 6.9, (B) pH 7.5, and (C) pH 8.1. (D) While the total luminescence intensity tends to decline over time after the addition of substrate, the BRET ratio (525∶475 nm) is constant over time. (E) Comparison of BRET ratio calibration measured in vitro by two different methods, the “Emission scan mode” and the “Two-Wavelength Switching Mode” (see Methods for details). Error bars are +/− S.D., but in most cases the error bars are so small that they are obscured by the symbols (n = 3).

