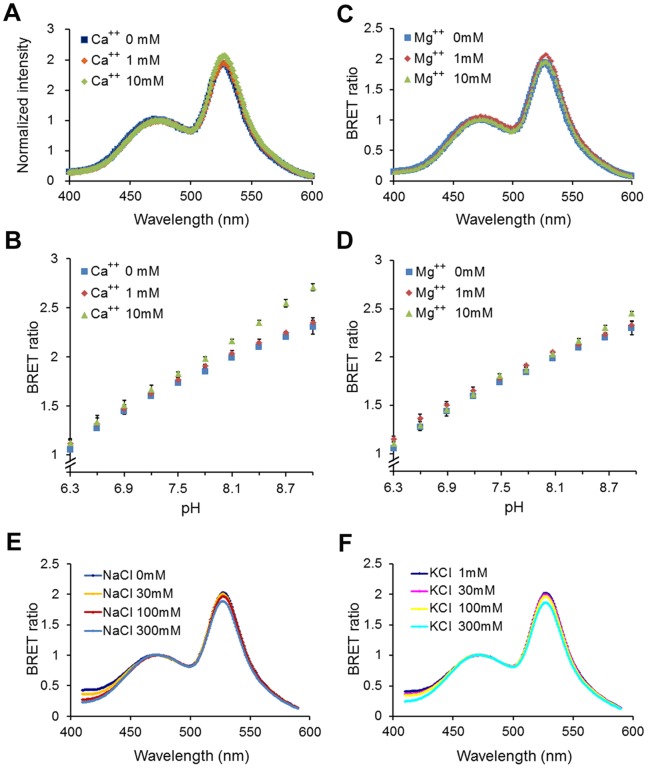
Figure 4. pHlash is not sensitive to other ions.
(A) Normalized luminescence emission spectra at pH 7.5 in buffers with different amounts of added CaCl2. Spectra were normalized to the peak at 475 nm (there was a slight increase between 1 and 10 mM CaCl2 in the total luminescence intensity, but not in the 525∶475 nm ratio). (B) BRET ratio (525∶475 nm) at different [CaCl2]. Note that “0 mM CaCl2” means that no CaCl2 was added, and since there was ∼30 µM EGTA carried over from the enzyme stock solution, “0 mM CaCl2” will be sub-nanomolar concentrations of Ca++. (C) Normalized luminescence emission spectra at pH 7.5 in buffers with different amounts of added MgCl2. Spectra were normalized to the peak at 475 nm. (D) BRET ratio (525∶475 nm) of pHlash at different amounts of MgCl2. (E) Normalized luminescence emission spectra at pH 7.5 in buffers with different concentrations of NaCl. (F) Normalized luminescence emission spectra at pH 7.5 in buffers with different concentrations of KCl. The buffer used in these experiments was the same as described in Fig. 1 legend except with the addition of CaCl2, MgCl2, NaCl, or KCl. For panels B and D, error bars are +/− S.D., but in most cases the error bars are so small that they are obscured by the symbols (n = 3).

