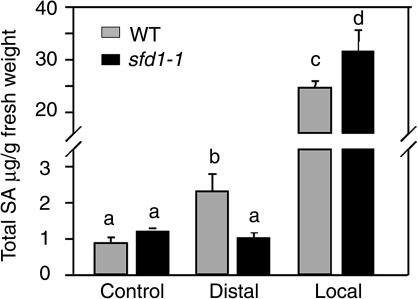
Figure 4.
Total SA Content in the Leaves of Pathogen-Inoculated Wild-Type and sfd1-1 Mutant Plants.
Total SA (SA + SAG) accumulation in the wild-type (gray bars) and sfd1-1 (black bars) plants. Leaf samples were taken from untreated plants (Control) and from the pathogen-inoculated (Local) and uninoculated leaves (Distal) of a plant inoculated 2 d earlier with a suspension containing 107 cfu/mL of P. s. tomato DC3000 carrying the avirulence gene avrRpt2. The total SA concentration is expressed as micrograms of total SA per gram of fresh weight of leaf tissue. All values are the mean of five samples ±sd. The difference between any two bars with different letters at the top is statistically significant (>95% confidence), whereas bars with the same letter indicates that the difference between the two values is statistically insignificant.

