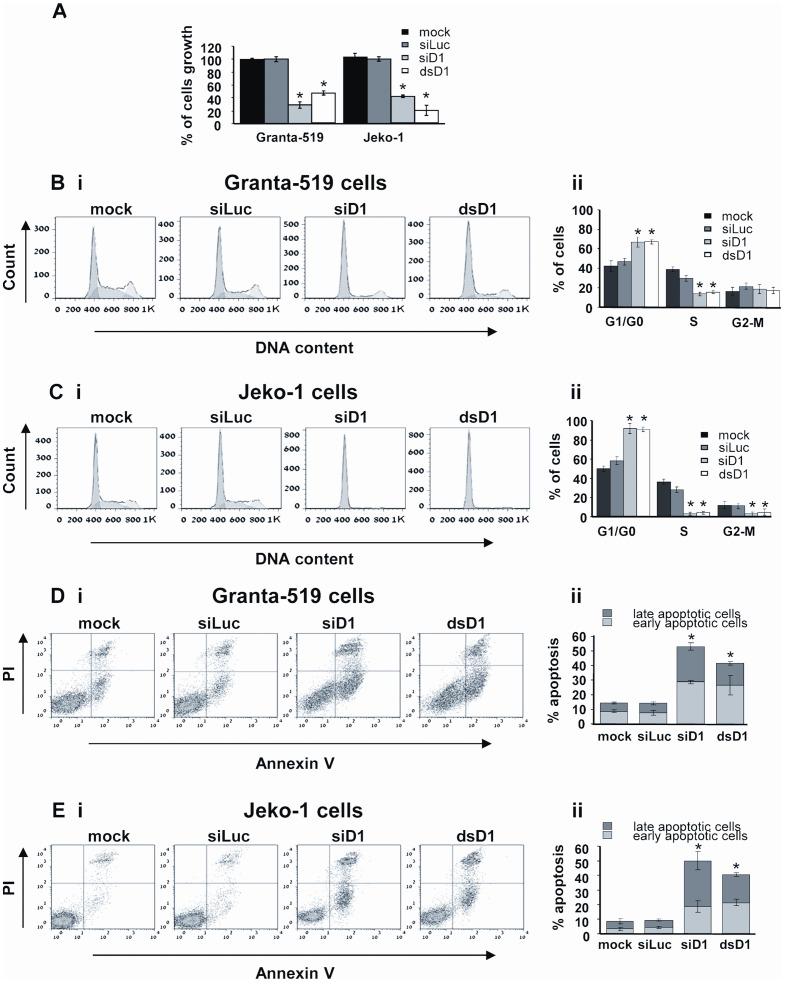
Figure 2. Effects of cycD1 down regulation on cell growth, cell cycle and apoptosis.
(A) Proliferation rates of the untreated (mock), siLuc, siD1 and dsD1 electroporated Granta-519 and Jeko-1 cells as determined by the XTT cell proliferation assay, 7d post 1st electroporation (5d post the 2nd one). The results are demonstrated as percentage of cell growth in comparison to the siLuc electroporated cells. (B–C) Cell cycle distribution of mock, siLuc, siD1 and dsD1 electroporated Granta-519 (B) and Jeko-1 (C) cells, 72 h post 1st electroporation (48 h post the 2nd one). (i) Representative cell cycle histograms analysis, applied with the Dean-Jett-Fox model, using FlowJo™ software. (ii) Cell cycle distribution, demonstrated as percentage of cells in each phase. (D–E) apoptosis of mock, siLuc, siD1 and dsD1 electroporated Granta-519 (D) and Jeko-1 (E) cells, 8d post the 1st electroporation (6d post the 2nd one). (i) Representative dot-blot analysis using FlowJo™ software. Early apoptosis is demonstrated on cells labeled with Annexin V, while late apoptosis is demonstrated by Annexin V and PI labeled cells. (ii) Percentage of total apoptotic cells (divided into early and late fractions). All data are represented as the mean ± SEM of three independent experiments. Significance was evaluated using one tailed ANOVA. * indicates p value <0.001.

