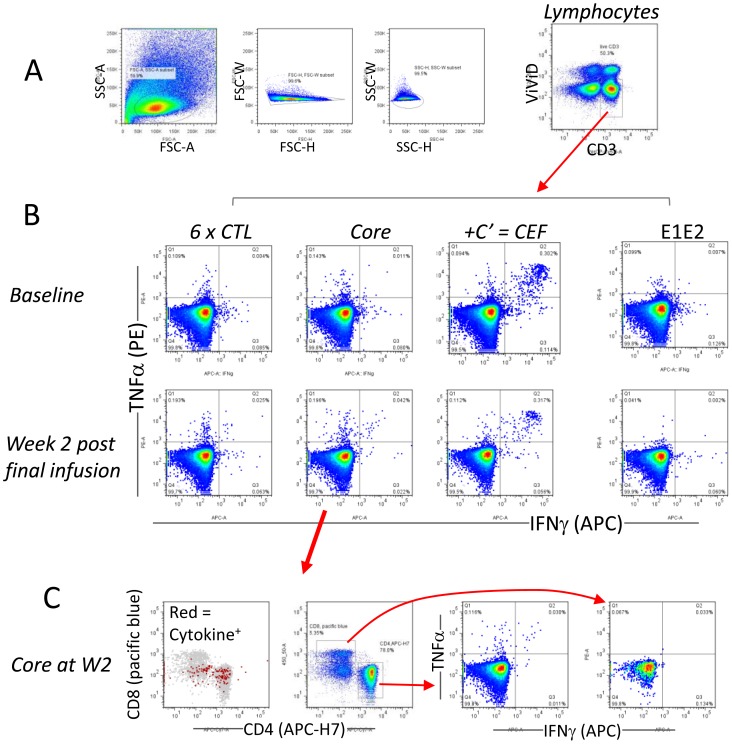
Figure 1. Gating strategy and example of ICS data.
(A) Lymphocytes were gated based on FSC and SSC, followed by a CD3+ViViD− viable T cell gate. (B) Example of data from PT#3, depicting typical positive (6×CTL, core antigen) and negative (E1E2 antigen) responses following DC infusion compared to baseline. (C) These plots are derived from the same data as the core antigen response at week 2 (W2), depicting the cellular source of the cytokines. The 1st plot (left) shows cytokine positive cells (red) within viable CD3 T cells (grey), the 2nd plot shows the position of the CD4+ and CD8+ T cell gates, and the 3rd and 4th plots depict the cytokine staining profiles of CD4+ T cells and CD8+ T cells respectively.

