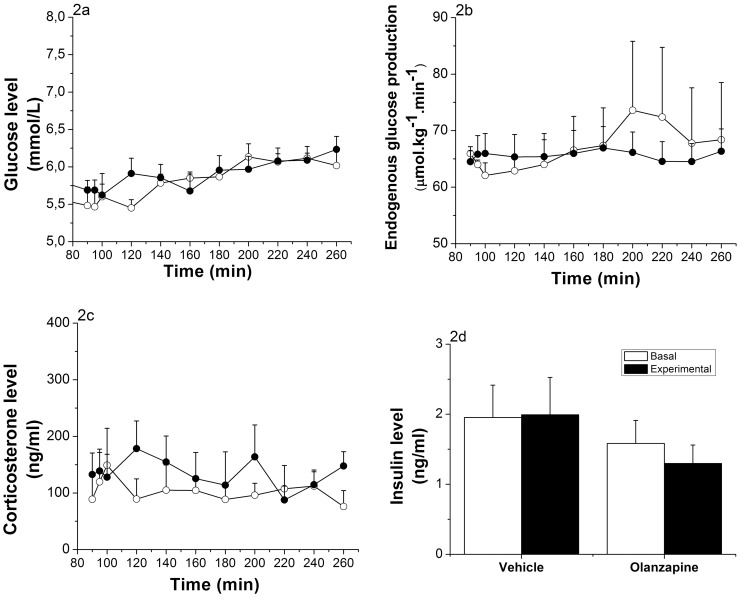
Figure 2. Effects of ICV infusion of Olanzapine.
(Vehicle group n = 6, Olanzapine group n = 9). 2a: Glucose evolution before (t = 90 to t = 100) and during (t = 120 to t = 260) ICV Olanzapine infusion (30 µg/kg/h). No significant differences between the 2 groups were detected (ANOVA repeated measures; Time, p<0.001; Time * Group, p = 0.59; Group, p = 0.635). 2b: Endogenous glucose production before (t = 90 to t = 100) and during (t = 120 to t = 260) ICV Olanzapine infusion. No significant changes were detected (ANOVA repeated measures; Time, p = 0.731; Time * Group, p = 0.709; Group, p = 0.84). 2c: Corticosterone levels before (t = 90 to t = 100) and during (t = 120 to t = 260) ICV Olanzapine infusion. No significant changes were detected (ANOVA repeated measures; Time, p = 0.971; Time * Group, p = 0.631; Group, p = 0.546). 2d: Plasma insulin levels before (mean of time points t = 90 and t = 100) and at the end (mean of time points t = 220 and t = 260) of the ICV infusion of Olanzapine. No significant changes were detected (ANOVA repeated measures; Time, p = 0.722; Time * Group, p = 0.638; Group, p = 0.274). Vehicle-treated animals = white dots; Olanzapine-treated animals = black dots.

