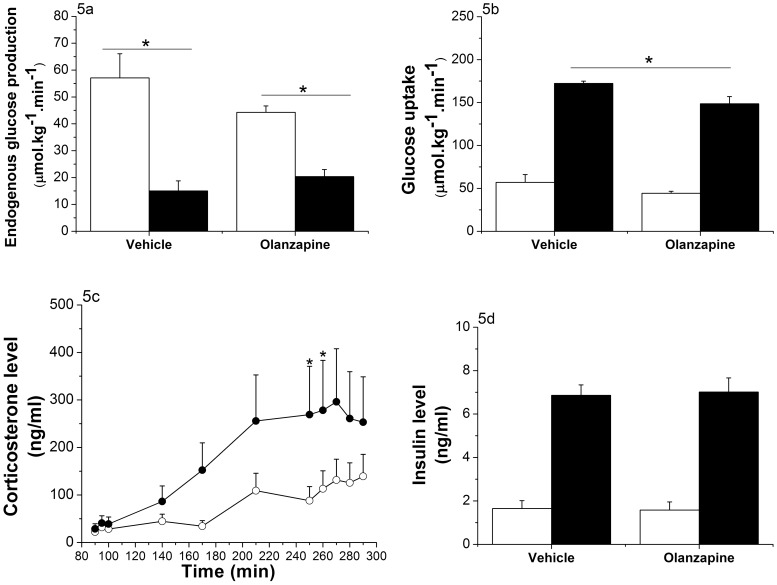
Figure 5. Effects of intragastric infusion of Olanzapine (t = 130 to t = 290; 3 mg/kg/h) on glucose disappearance (Experiment 3).
(Vehicle group n = 8, Olanzapine group n = 7) 5a: Endogenous glucose production at basal (mean of 3 time points: t = 90 to t = 100; white bars) and during the hyperinsulinemic state (mean of 5 time points: t = 250 to t = 290; black bars). EGP is significantly decreased in both groups (p<0.001), but the decrease is smaller in the group treated with Olanzapine (ANOVA repeated measures; Time, p<0.001; Time * Group, p = 0.018; Group, p = 0.604). 5b: Glucose disappearance at basal (mean of 3 time points: t = 90 to t = 100; white bars) and during the hyperinsulinemic state (mean of 5 time points: t = 250 to t = 290; black bars). Glucose disappearance is significantly increased in both groups (ANOVA repeated measures; Time, p<0.001; Time * Group, p = 0.475; Group, p = 0.005). This increase is significantly smaller for the group treated with Olanzapine (p = 0.014, One-Way ANOVA). 5c: Corticosterone levels are significantly increased by the Olanzapine treatment (ANOVA repeated measures; Time, p<0.001; Time * Group, p<0.005; Group, p = 0.035). Vehicle-treated animals = white dots; Olanzapine-treated animals = black dots. 5d: Plasma insulin levels are elevated 4.4-fold in both groups during the hyperinsulinemic state (mean of 3 time points; black bars) compared to the basal level (mean of 2 time points; white bars) (ANOVA repeated measures; Time, p<0.001; Time * Group, p = 0.787; Group, p = 0.938). *p<0.05.

