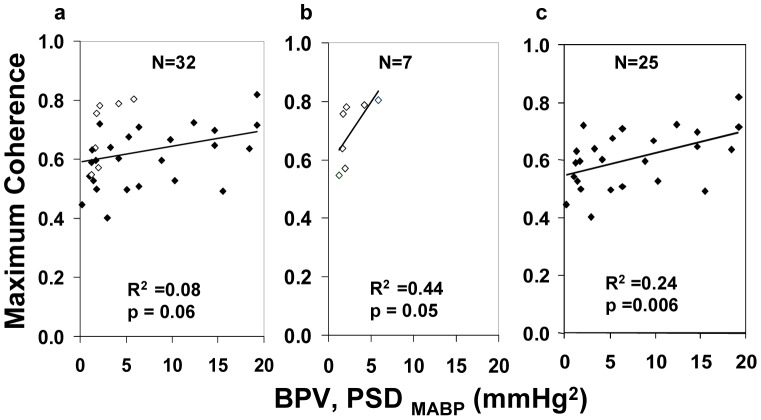
Figure 4. Correlation between the Maximum Coh (MABP with TOI) and BPV (a) Trend for positive correlation for all infants: ◊ 7 sickest infants; ♦ stable infants.
(b) ◊ sickest infants show high Maximum Coh with relatively low BPV. (c) ♦ stable infants with sickest infants excluded exhibit a significant positive relationship.

