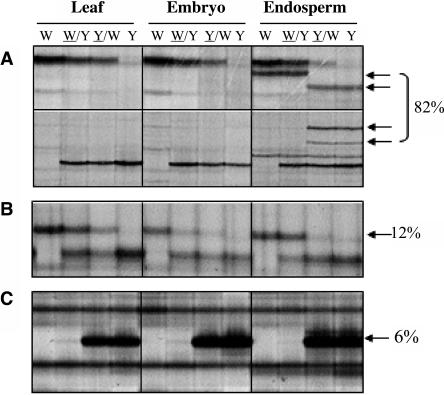
Figure 4.
Analysis of DMRs in Leaf, Embryo, and Endosperm Tissues by MSAP.
Representative MSAP profiles of an EcoRI/HpaII digest of DNA extracted from 2-week-old leaf tissues and from embryos and endosperm harvested at 15 DAP of the inbred lines W64A, A69Y, and their reciprocal crosses. The percentage of MMPs that exhibited each profile is indicated at the right. Arrows indicate MMPs, and abbreviations are as in Figure 1.
(A) Restriction fragments that showed an MMP specific to the endosperm.
(B) A restriction fragment that was detected in all tissues but only showed an MMP in the endosperm.
(C) A restriction fragment that showed an MMP in all tissues (a common MMP).

