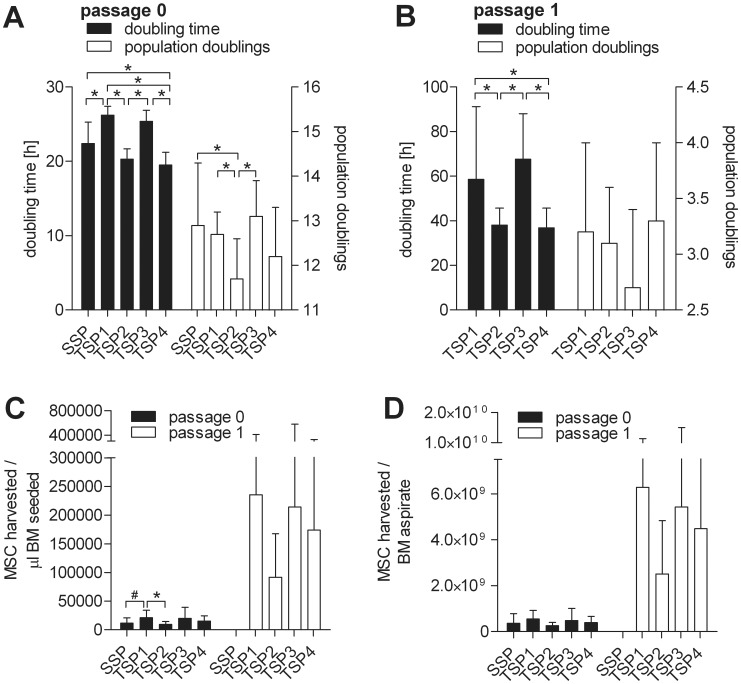
Figure 3. Comparative analysis of MSC yields. Shown are mean and SD values of A. doubling time and populations doublings of passage 0, B. doubling time and populations doublings of passage 1, C.
MSCs harvested per ml BM seeded and D. MSCs harvested per total BM aspirate for all of the established GMP-compliant expansion protocols at passage 0 and passage 1. *indicates statistically highly significant (p<0.01). #indicates statistically significant (p<0.05).

