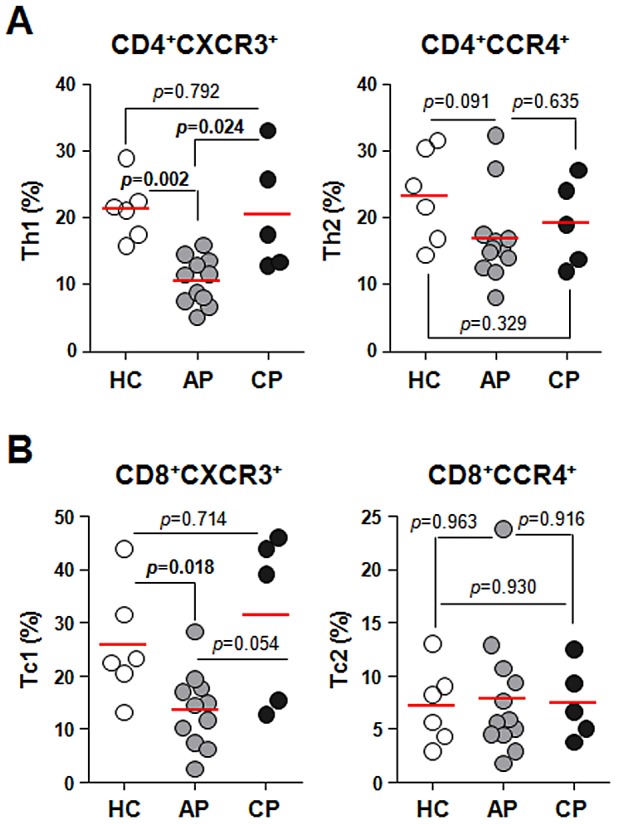
Figure 3. Profiles of type 1 and type 2 T cells in peripheral blood of scrub typhus patients.

PBMCs were stained with antibodies against CXCR3, CCR4, CD4, and CD8 and then analyzed on a flow cytometer. A. The frequencies of Th1 (CD4+CXCR3+) or Th2 (CD4+CCR4+) within CD4+ T cells were compared among healthy controls (HC, n = 6, open circle) and the patients in acute phase (AP, n = 12, gray circle) or convalescent phase (CP, n = 5, black circle). B. The frequencies of Tc1 (CD8+CXCR3+) and Tc2 (CD8+CCR4+) within CD8+ T cells were compared among healthy controls and the patients as in A. Red bars indicate the mean value and p values were obtained using the Mann-Whitney U test. Statistically significant p values (<0.05) are shown in bold.
