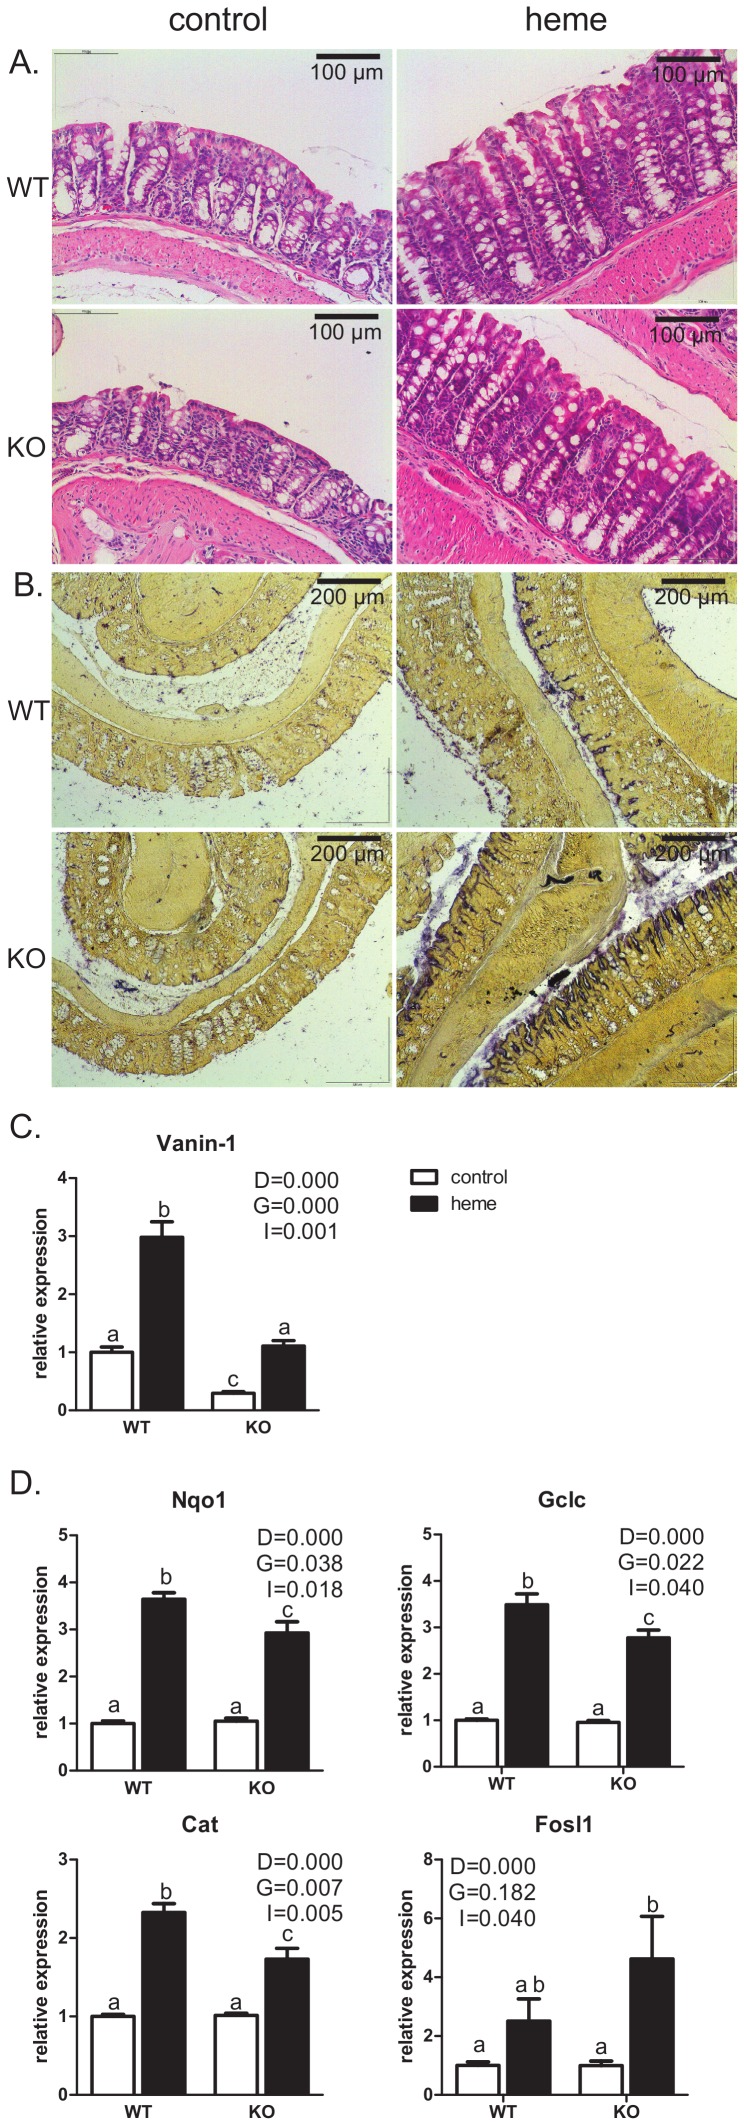
Figure 4. Heme-induced stress response.
A. Representative pictures of H&E staining of mouse colonic mucosa after 14 days of control- versus heme diet. B. Representative pictures of colon tissue stained for Alkaline phosphatase activity, a marker for ROS stress. C. Expression of Vanin-1. D. Expression of genes involved in antioxidant response Nqo1, Cat, Gclc and Fosl1. Expression of the WT control group is set to one. Expression of all other groups is relative to WT control. P-values for main effects (D for diet, G for genotype and I for interaction) by a two-way ANOVA are indicated. A,b and c indicate significant different groups (p<0.05) determined by a Bonferroni post hoc-test.

