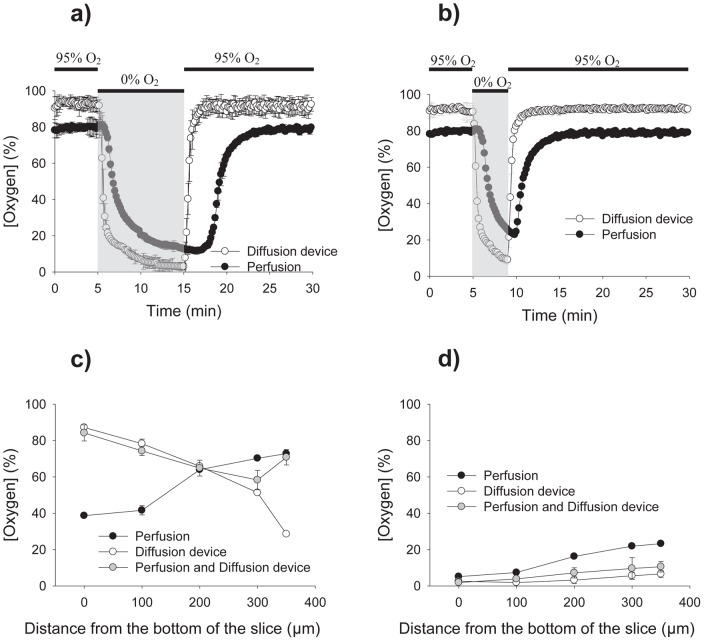
Figure 2. Validation of the microfluidic device with an oxygen sensor.
A–B. Using an oxygen probe (Neofox, Ocean Optics) and a transient hypoxic stimulus lasting 10 and 4 minutes, the oxygen concentration dissolved in the aCSF was measured for the diffusion device and the traditional perfusion. No slice was present during these experiments. The diffusion device obtains a more controlled as well as a bigger change in oxygen concentration. C. Using the oxygen sensor mounted to an electric translation manipulator, the oxygenation at depths of 0, 100, 200, 300, and 350 µm were measured, with 0 µm marking the bottom of the chamber. Perfusion and device measurements are recorded. The graph shows the oxygen concentration during the oxygenation period (95% O2). D. The graph shows the oxygen concentration inside the tissue obtained at the end of the hypoxic stimulus.

