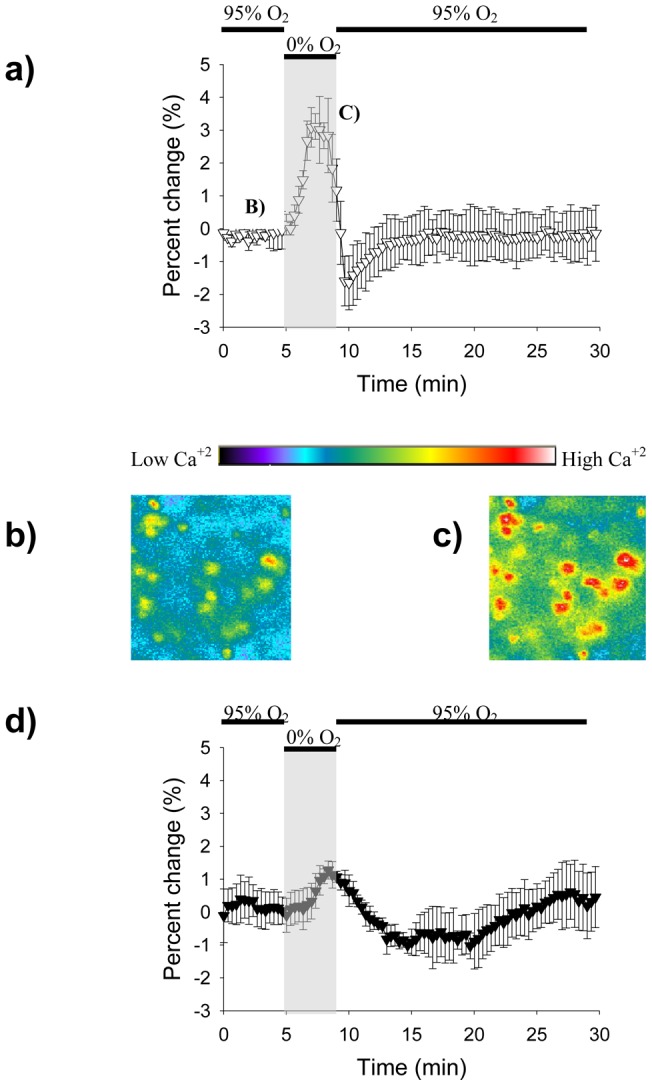
Figure 3. Fura readings for the diffusion device and the perfusion method.

A. Graph showing the Fura signal obtained by the microfluidic device. Increases in signal intensity signify an increase in intracellular calcium. The hypoxic period is represented by the gray rectangle. B–C. 10X magnification images showing CA1 cells before and during the hypoxia period. The increase in fluorescence in C corresponds to an increase in intracellular calcium as previously mentioned. D. Graph showing the Fura signal obtained by the perfusion method.
