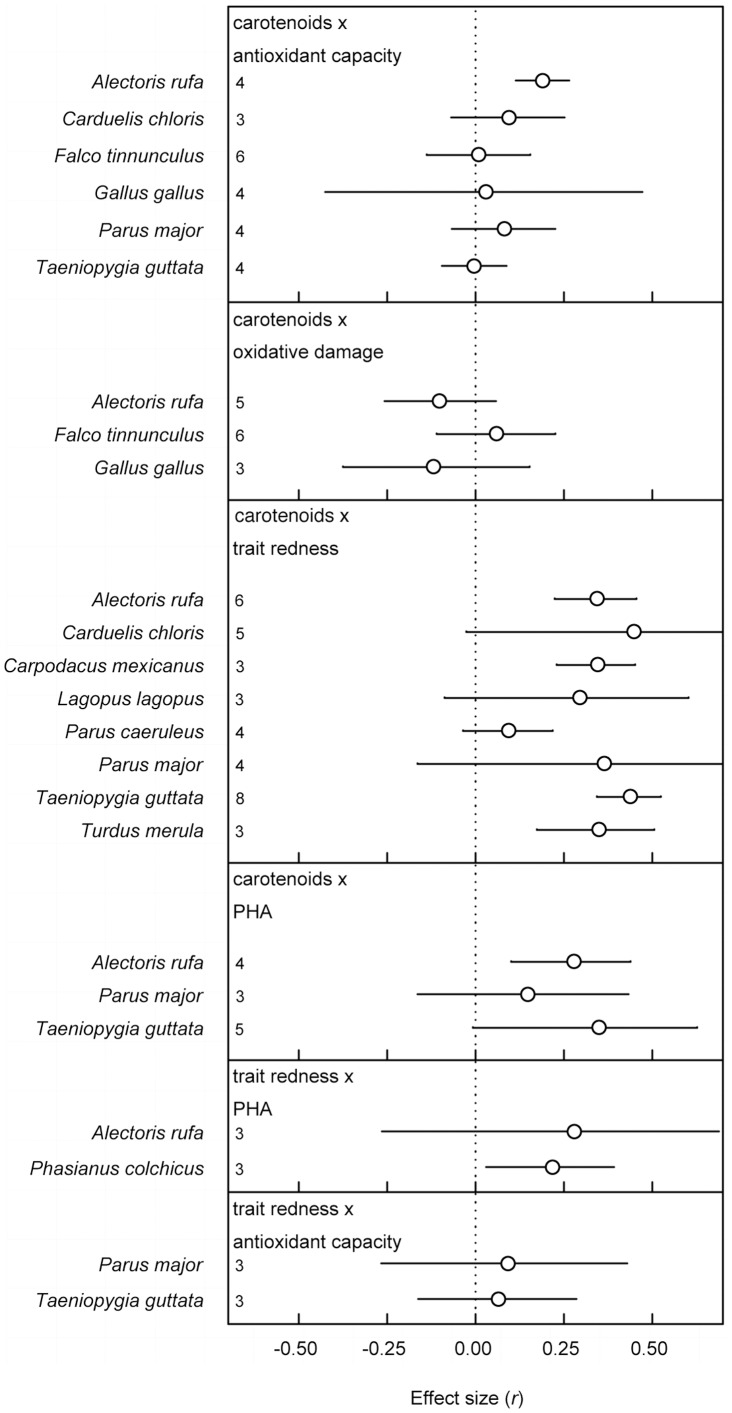
Figure 3. Plot of separate overall effect sizes (±95% confidence interval) per species.
An overall effect size per species was only calculated when three or more studies were available per relationship of interest. Numbers along the y-axis depict the number of effect sizes included in each overall effect size.

