
Figure 2. Size distribution of all forest patches surveyed (left, N = 196) or not surveyed (right, N = 613,997 patches >0.25 ha) within the entire study region (∼252,669 km2).
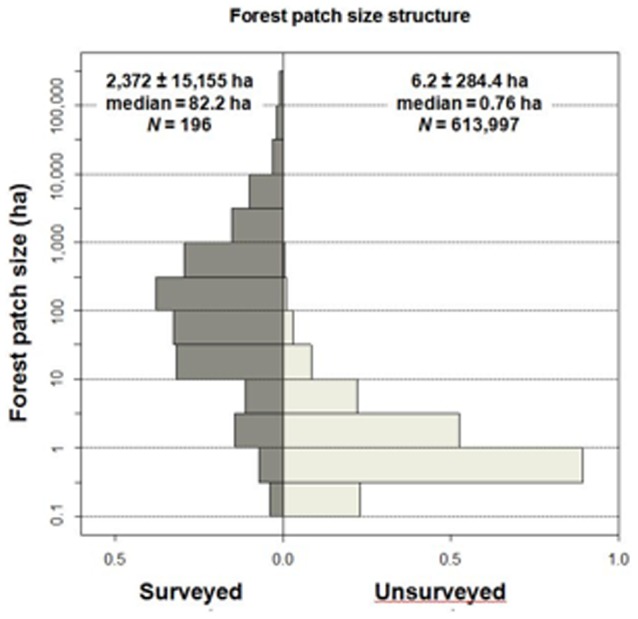
Numerical representation of different-sized patches are expressed in terms of proportions of the total.