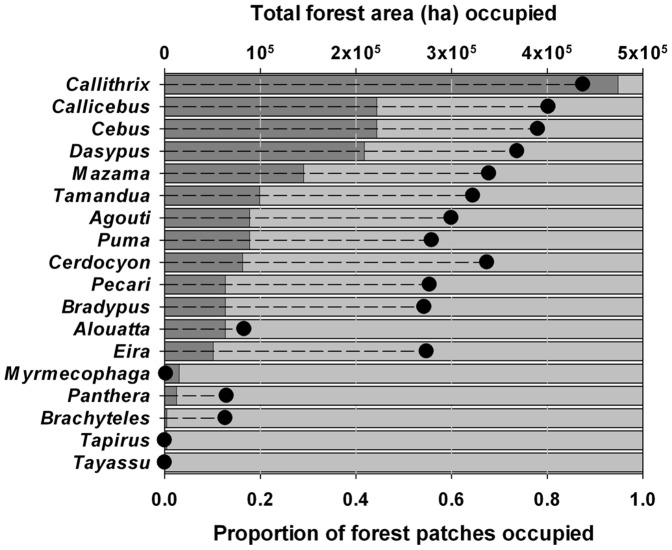
Figure 4. Levels of forest patch occupancy for 18 mammal species surveyed throughout the Atlantic Forest study region of northeastern Brazil.
Species are ordered top to bottom according to increasing level of patch occupancy. Dark-gray bars indicate the proportion of all 196 forest patches occupied by each species (see Table 1 for full Latin and English names), and solid circles indicate the aggregate forest area contained within all occupied patches.

