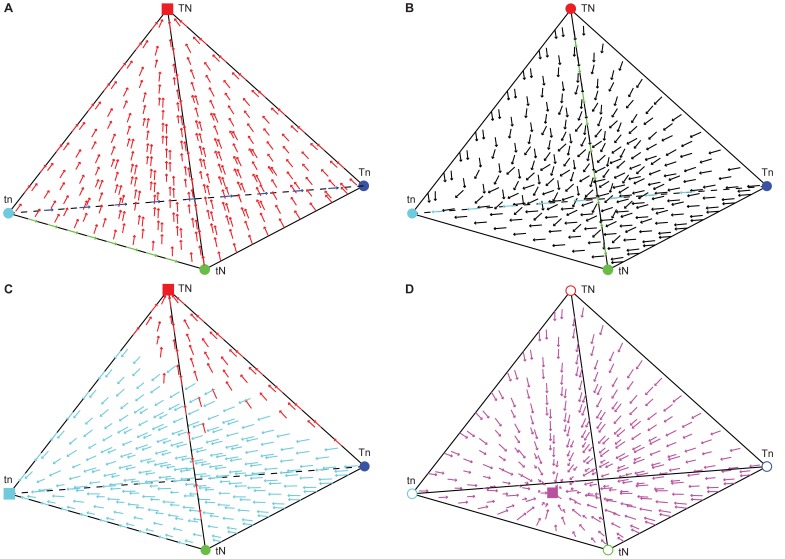
Figure 2. Cultural transmission in different subsets of the parameter space.
In this and subsequent figures, a filled square at a vertex indicates a stable fixation at that vertex. A filled circle indicates an equilibrium that is unstable except in a specific hyperplane. Inside the tetrahedron, arrows originate at the population's initial phenotype frequencies and point toward the equilibrium. Arrows are color-coded by the equilibrium approached (TN: red, Tn: blue, tN: green, tn: cyan, tN-tn edge: black, internal polymorphism: pink). A. No selection, no assortative mating, no cultural mutation: when b 1+b 2>1 and c 1+c 2>1, the TN vertex is stable. When 0<α 1, α 2<1, the same vertex is stable. B. No selection, no assortative mating, no cultural mutation: when b 1+b 2<1, the t state approaches fixation, and if c 1+c 2 = 1, N and n persist in their initial proportions. Any point along the edge connecting the tn and tN vertices can represent an equilibrium. C. Selection but no assortative mating, no cultural mutation. For certain parameters, cultural transmission favors fixation of one phenotype but selection favors another. In some of these cases, two fixations are stable and which is approached depends on the initial frequencies. In the case shown here, α 1 = α 2 = 0, b 0 = c 0 = 0, b 3 = c 3 = 1, b 1 = 0.8, b 2 = 0.5, c 1 = 0.5, c 2 = 0.2, σ 1 = −0.2, and σ 2 = −0.6. The transmission favors T and n, but Tn is selected against, so the population approaches fixation of either TN or tn depending on initial frequencies. D. Assortative mating, selection, and cultural mutation. From all initial phenotype frequencies, the population will approach a single stable polymorphism. In this case, α 1 = 0.1, α 2 = 0.1, b 0 = 0.05, b 1 = 0.49, b 2 = 0.52, b 3 = 0.95, c 0 = 0.05, c 1 = 0.51, c 2 = 0.53, c 3 = 0.95, σ 1 = −0.2, and σ 2 = −0.1. At equilibrium, x 1≈0.1438, x 2≈0.0492, x 3≈0.6262, and x 4≈0.1808.

