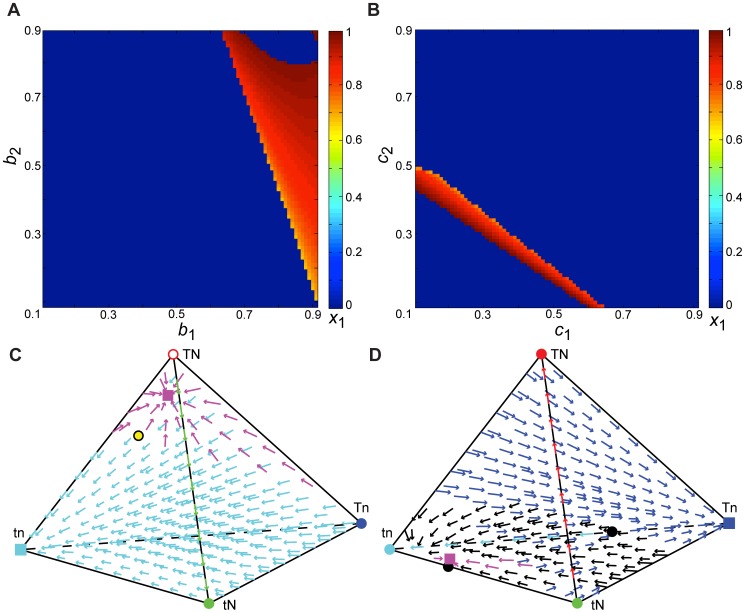
Figure 3. Cultural transmission with assortative mating and selection but no cultural mutation.
For most parameter sets, the population approaches a single vertex; in rare cases a stable polymorphism is also present. Panels A–C show the parameter values α 1 = 0.8, α 2 = 0.3, b 0 = 0, b 1 = 0.7, b 2 = 0.7, b 3 = 1, c 0 = 0, c 1 = 0.5, c 2 = 0.2, c 3 = 1, σ 1 = −0.2, σ 2 = −0.7, and A–B shows varied pairs of transmission parameters. A. The effect of transmission of T on the presence of a polymorphism. The x-axis represents the value of b 1, the y-axis represents the value of b 2, and the color scale shows the value of x 1. B. The effect of transmission of N on the presence of a polymorphism. The x-axis represents the value of c 1, the y-axis represents the value of c 2, and the color scale represents the value of x 1. C. The pink square represents a stable polymorphism (x 1≈0.814, x 2≈0.0162, x 3≈0.0937, x 4≈0.0763). Pink arrows illustrate the domain of attraction of this equilibrium. The yellow circle represents an unstable equilibrium between the domains of attraction of the polymorphism and the tn vertex. D. A polymorphism where c 1+c 2 = 1. For some initial frequencies, the population approaches a single fixed point at the blue square. The pink square represents a stable polymorphic internal equilibrium, pink arrows illustrate the domain of attraction of this equilibrium. Red, green, cyan, and black circles represent unstable equilibria. Black arrows begin at initial conditions that result in an equilibrium on the tN-tn edge of the tetrahedron. Black circles represent unstable equilibria on the n and t fixation edges. In this case, α 1 = 0.8, α 2 = 0.3, b 0 = 0, b 1 = 0.2, b 2 = 0.3, b 3 = 1, c 0 = 0, c 1 = 0.3, c 2 = 0.7, c 3 = 1, σ 1 = 0.2, and σ 2 = 0.4.

