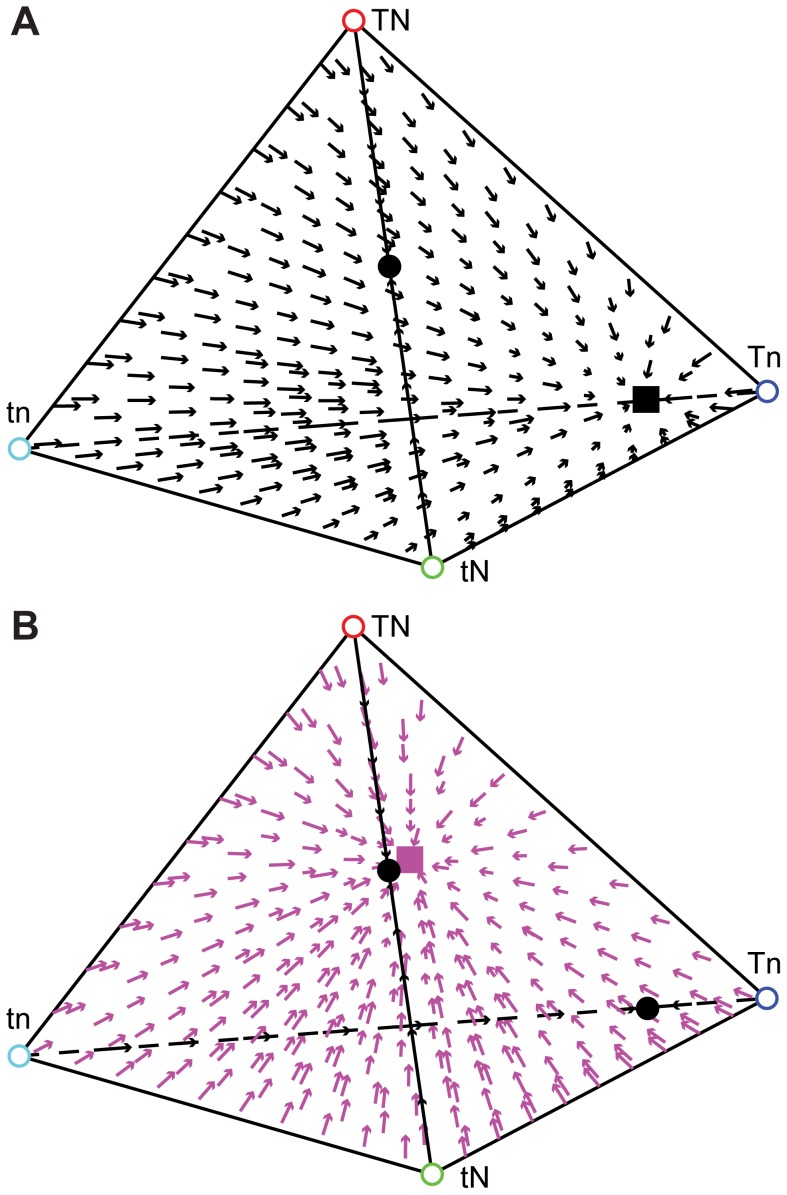
Figure 5. Model for the evolution of religious beliefs.
Small fitness differences can alter the evolutionary dynamics of cultural traits. N represents the genetically transmitted religious predisposition trait and T represents the culturally transmitted belief trait. For both panels, α 1 = 0.73, α 2 = 0.94, b 0 = 0.02, b 1 = 0.3, b 2 = 0.31, b 3 = 0.98, c 0 = 0, c 1 = c 2 = 0.5, and c 3 = 1. A. When σ 1 = σ 2 = 0.12, a stable equilibrium exists on the Tn-tn edge (black square), i.e. fixation of the non-religiosity allele (n) and a polymorphism between religious belief (T) and non-belief (t), which is approached from all starting points except those on the TN-tN edge, which approach the equilibrium illustrated by the black circle. B. When σ 1 = 0.12 and σ 2 = 0.11, a stable polymorphism (pink square) exists such that both religious and non-religious predispositions, as well as religious belief and non-belief, coexist in the population (x 1≈0.521, x 2≈0.127, x 3≈0.295, x 4≈0.057). This polymorphism is approached from all starting points except those on the TN-tN or Tn-tn edges, which approach the equilibrium illustrated by the black circles.

