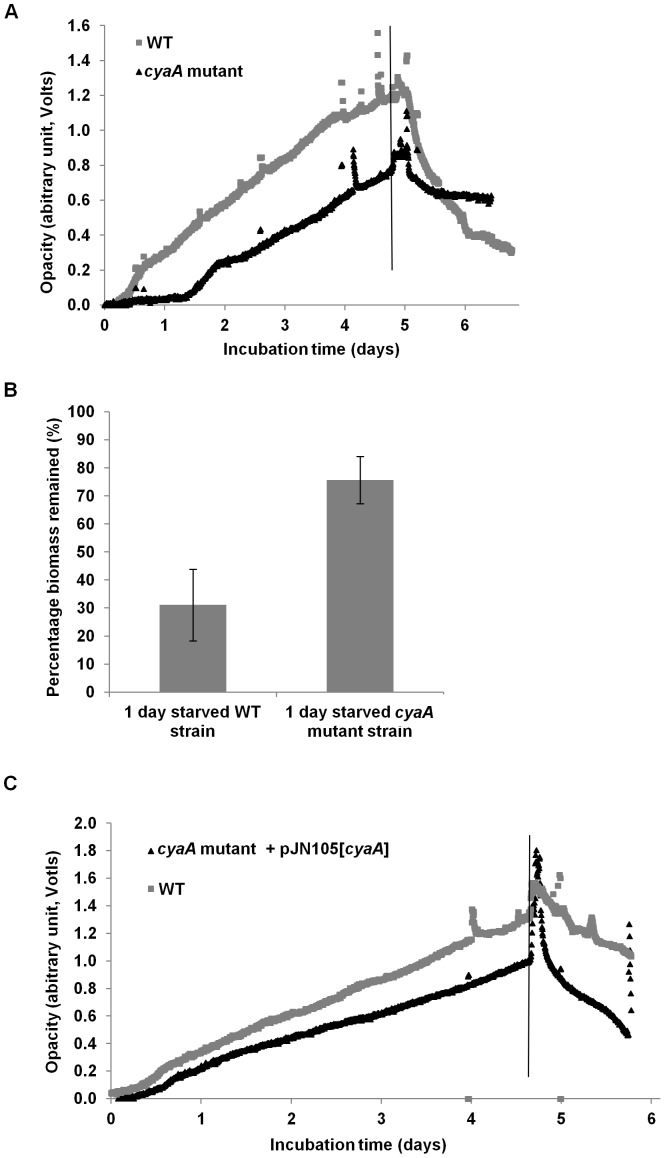
Figure 6. Biofilm formation and response to glucose starvation.
P. aeruginosa PAO1 WT (grey) and cyaA mutant (black) biofilm formation and response to starvation was determined by biofilm-opacity measurement (A). Percentage of of cyaA biomass remaining after 1 day of glucose starvation (p<0.05) as determined by the biofilm-opacity monitoring system (B); error bars represent standard error. Biofilm formation and response to glucose starvation of P. aeruginosa PAO1 WT (grey) and complemented cyaA mutant (black) as determined by biofilm-opacity measurement (C). Glucose starvation was induced at the time shown by the vertical line.

