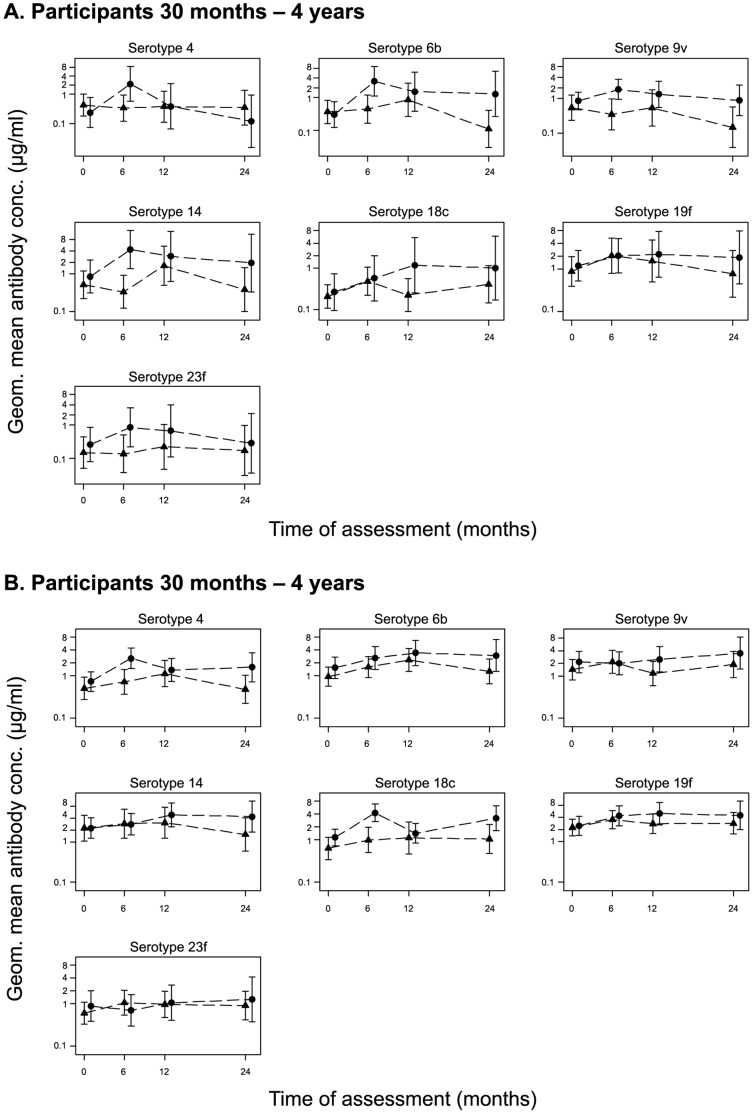
Figure 2. Geometric mean (95% CI) IgG response to vaccine serotypes in vaccinated and control communities.
The GM of antibody concentrations to the PCV-7 serotypes are plotted at the time of CSS 1 to 3 coinciding with the three different time points after vaccination, 4–6 months, 12 months and 24 months for the vaccinated (circles) and control (triangles) communities for participants 30 months to 4 years (A), and 5 years and above (B). Note that samples were taken at the same periods but shifted in figure to avoid overlaps that might hide some points.

