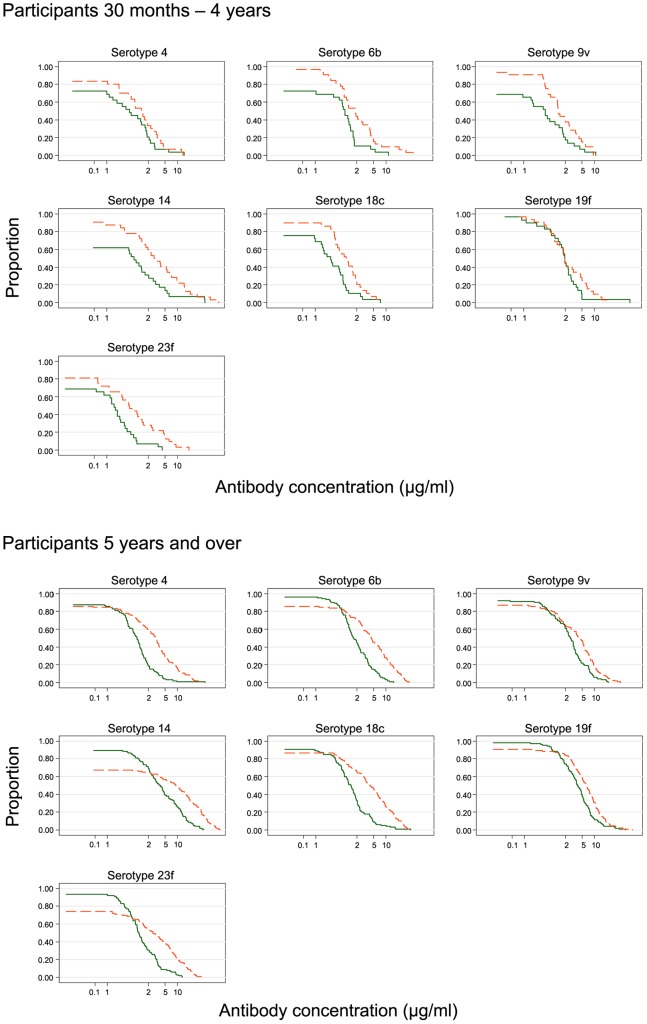
Figure 3. Reversed cumulative plots showing the proportion of individuals with an IgG pneumococcal antibody concentration above a particular value following vaccination.
The proportion of individuals with serotype-specific IgG antibody concentrations from vaccinated (broken lines) and control (solid lines) communities in the (A) young and (B) older groups using combined data from CSS1–CSS3 are shown.

