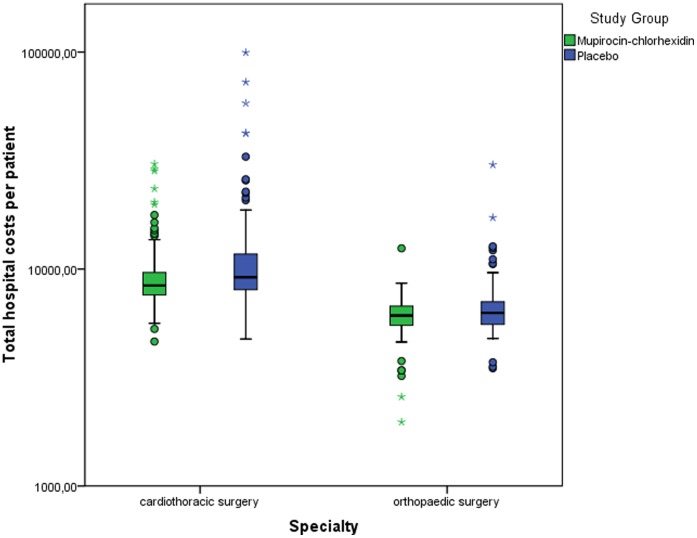
Figure 2. Box plot of total hospital costs for patients treated prophylactically with MUP-CHX or placebo.
Total costs were estimated for the period between the dates of admission and the end of follow-up. Data are shown for cardiothoracic patients and orthopaedic surgical patients, separately. Patients with highest costs are shown in bullets • (between 1,5 and 3 times the interquartile range) and asterisks * (more than 3 times the interquartile range).

