Figure 4.
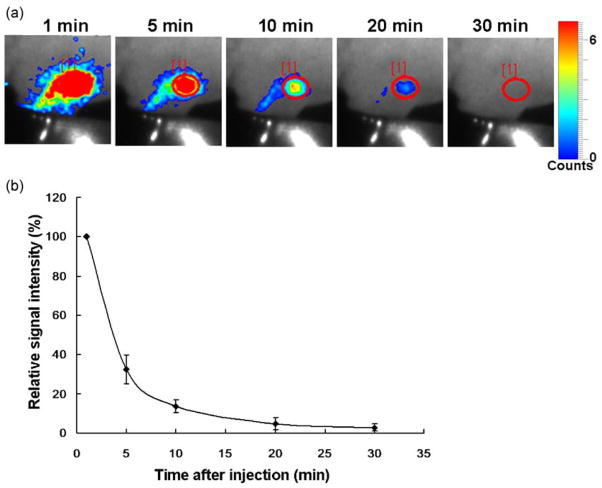
Dynamic serial images of BRET lymphatic imaging in a mouse receiving BRET-Qdot655 injection at the left paw (a). Graph of relative signal intensity (n =3, 100% at 1 min) shows that BRET signal rapidly decreases with time (b). Note that the same scale, adjusted for the 10 min image, is used for all images.

