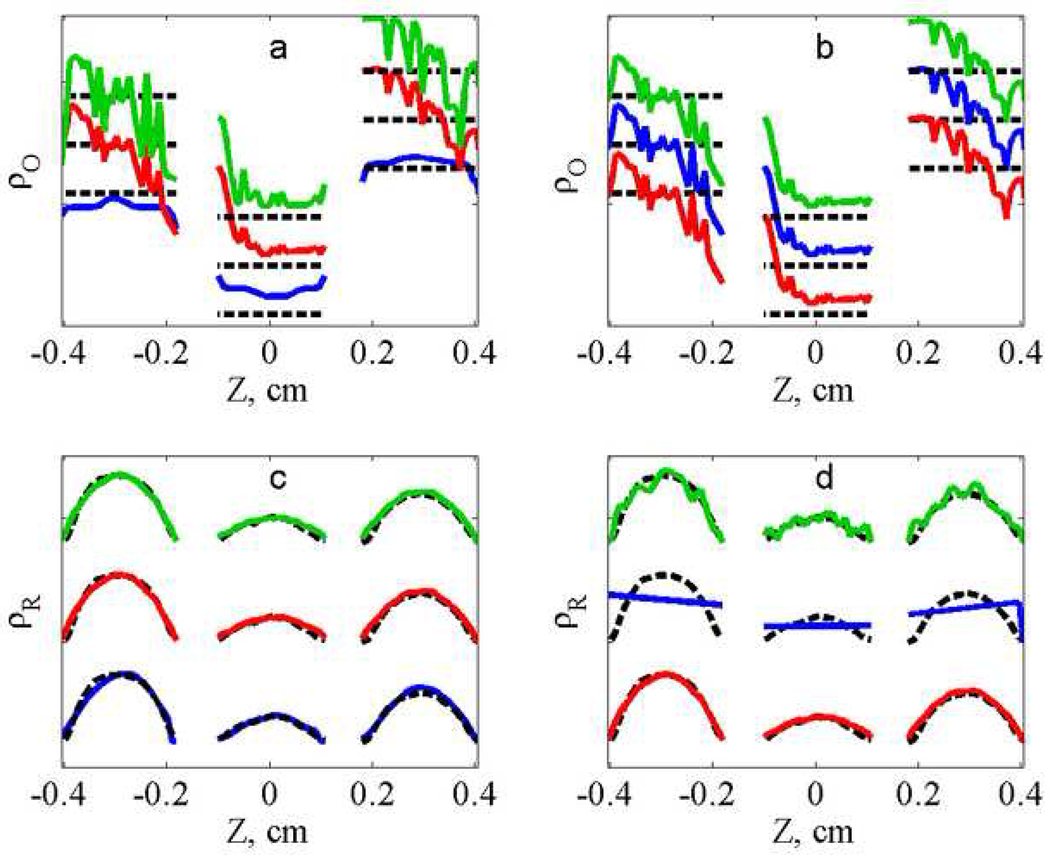
Figure 6.
Impact of ΓR and ΓO on radical and linewidth profiles for the lower noise data set. (a,c) varying ΓO = 0.11 (lower, blue traces), 1.1 (middle, red traces), and 2.1 G/cm (top, green traces) with constant ΓR = 0.06 and (b,d) varying ΓR = 0.005 (lower, blue traces), 0.06 (middle, red traces), and 0.41 cm−1 (top, green traces) with constant ΓO = 1.1. Dashed black traces are the profiles in the phantom.

